XRP Daily RSI Trendline Breaks Down – What It Means For Price
After weeks of lower highs and higher lows, XRP’s daily candlestick price chart is now giving a signal that could dictate the next major move. Although the token is still holding above key horizontal levels near $2.13, t...
Archive context
Older archive item. Useful for background and entity history, but not a fresh market-moving signal.
After weeks of lower highs and higher lows, XRP’s daily candlestick price chart is now giving a signal that could dictate the next major move. Although the token is still holding above key horizontal levels near $2.13, technical data suggests momentum is starting to slip. A technical analysis of XRP’s daily RSI indicator offers a clue into what comes next, and it’s not necessarily bullish in the short term.
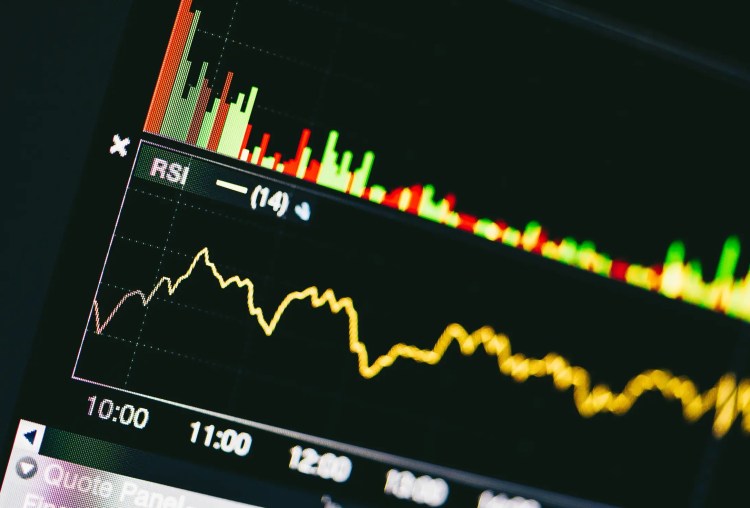
XRP RSI Breakdown: Loss Of Strength In MomentumAccording to an analysis posted by crypto chartist CasiTrades on the social media platform X, XRP’s Relative Strength Index (RSI) has just broken beneath a well-respected trendline that had been tracking higher lows since early April. The breakdown of this RSI structure, which is shown on the lower half of the chart below, is a strong shift in the short-term momentum dynamics for XRP.
It shows that despite the XRP price holding relatively flat above the 0.5 Fibonacci level at $2.13, internal market strength has clearly weakened.
The RSI had been forming a tightening wedge pattern for weeks, just like the price action’s compression at the apex of a symmetrical triangle on the daily timeframe. This type of RSI trendline break typically signals a coming volatility expansion, and as the analyst warns, the release may come with a sharp sweep to major support before XRP reverses.
It’s a common occurrence for major price reversals to be preceded by a push into lower supports. In the case of XRP, crypto analyst CasiTrades highlighted some price targets to watch for reversals in case there’s a breakdown in XRP price.
Support Levels At Risk: XRP Searching For Rebound LevelXRP’s price action is now entering an important test phase, one that could take its price lower before rebounding for the next major rally. Analysis from CasiTrades shows a few demand zones where buyers have stepped in. These demand zones are situated at $2.01, which aligns with the 1.236 Fibonacci extension, the $1.90 price level, and $1.55, which corresponds with the 0.618 retracement level from one of the recent rallies.
These levels are filled with enough liquidity, and until XRP breaks and holds above $3, these supports will always be in play. If XRP hits one of these support levels cleanly and exhibits a sharp V-shaped recovery, that would signal the market found its pivot.
However, if XRP approaches these levels and stalls or bounces prematurely, that may lead to a final shakeout move, forming a deeper low before the real reversal begins. Either way, the RSI breakdown has now tilted short-term risk toward the downside, at least until price confirms a strong reclaim above $2.50 and $3.
At the time of writing, XRP is trading at $2.11, down by 2% in the past 24 hours.
Featured image from Picjumbo, chart from TradingView
Why this matters
This altcoin story adds another data point to the current market tape and is useful when read alongside nearby source coverage.
Original source
Read on NewsBTCRelated market context

Ethereum (ETH) Price Prediction: ETH Holds Near $1,780 as Bulls Eye $1,860–$1,950, but $1,609 Remains Key Invalidation
Ethereum price is trading near $1,779 after a mixed 24-hour session, according to Brave New Coin data. ETH is down around 0.76% on...

Ether leads crypto's hold above key levels as bitcoin steadies over $63,000
A stalling rebound in AI and chip stocks and a stronger dollar kept the mood cautious as the second half gets underway.

IPO volume hits levels last seen in 1929 and 2000, and crypto markets are building the on-ramp
The surge in IPOs and crypto's role in facilitating access could signal heightened market volatility and regulatory challenges ahe...

Bitcoin miner bottom signal now depends on who survives weak mining profits
A Bitcoin miner-stress signal circulating on X has fallen into a zone analysts associate with severe miner pressure, putting a fam...

Vitalik Buterin Says Ethereum’s Next Major Upgrade Will Take Three to Four Years and Rival the Merge
Ethereum co-founder Vitalik Buterin says the network’s next major overhaul, an initiative researchers are calling “Lean Ethereum,”...

Ethereum Price Prediction: Vitalik Hints at 3-4 Years Long ETH Rebuild
Ethereum price is trading at $1,780 as Vitalik Buterin revealed the network’s biggest roadmap since the Merge, which somehow sends...