XRP Enters Phase 4 In Long-Term Chart Structure: Road To $21.5 Now Open
Technical analysis of XRP’s price action on the 3-week candlestick timeframe chart shows that the cryptocurrency is about to play out a road to the double-digit threshold based on its long-term structure. The analysis, w...
Archive context
Older archive item. Useful for background and entity history, but not a fresh market-moving signal.

Technical analysis of XRP’s price action on the 3-week candlestick timeframe chart shows that the cryptocurrency is about to play out a road to the double-digit threshold based on its long-term structure.
The analysis, which was shared on the social media platform X alongside a multiyear chart, points to XRP trading in what is labeled Phase 4. At the center of this setup is a clear technical target of a break above the previous all-time high and a run to at least $21.5
XRP Price Action In PhasesTechnical analysis of XRP price action shows that the cryptocurrency has been trading in a series of four phases for more than a decade. One full sequence of four phases unfolded between mid-2013 and mid-2017 as the foundation for XRP’s first rally to price peaks. Since then, a second set of four phases has been developing and following a similar pattern.
XRP transitioned into a new phase 1 and phase 2 sequence that led to a 2018 peak for phase 1 and then a pullback for phase 2 between 2018 and 2020. This was followed by an unusually long p3 that stretched from 2019 to mid-2024, visible on the chart as a broad, multi-year consolidation with converging trendlines of lower highs and higher lows. During this time, XRP’s price action was trapped inside the compression structure, just like the behavior seen during phase 3 of the first cycle.
XRP Price Chart. Source: @amonyx On X
Phase 4 Returns: XRP To Double DigitsAccording to the technical analysis, phase 4 began in 2025, when XRP finally broke above the compression range in mid-2024. This breakout was the same structural transition seen in mid-2017, when XRP exited consolidation and entered expansion.
Phase 4 has already been in progress for several months and includes the period when XRP rallied to new all-time highs in mid-2025, eventually topping out at $3.65 in July. Since that peak, however, XRP’s price action has been playing out a corrective downward trend and is down by roughly 48% at the time of writing.
Despite the ongoing correction, the projection is that XRP is still in phase 4 and is going to break into new all-time highs soon. This shows that phase 4 could unfold over an extended period and not with a single impulse move. The current all-time high of $3.65 is the first major technical hurdle, and a break above it will serve as confirmation that XRP is back into price discovery.
Based on this technical analysis, past expansion ratios from the previous cycle are applied and a 6.618 Fibonacci extension is measured from the phase 3 support low. This points to a projected price level near $21.5. At the time of writing, XRP is trading at $1.89, meaning a move to that level would represent an increase of roughly 1,040% from current prices.
Featured image from Pexels, chart from TradingView
Why this matters
XRP is a tracked market entity in the DigitalMoneyBox archive, making this useful context for readers monitoring repeated mentions and follow-up coverage.
Original source
Read on NewsBTCRelated market context

XRP Price Prediction: Elliott Wave Setup Points to $3 as XRP Nears a Potential $2 Breakout
XRP Price Prediction: Elliott Wave Setup Points to $3 as XRP Nears a Potential $2 Breakout XRP is approaching a critical technical...

Sam Altman ChatGPT AI Predicts Bitcoin to Hit Insane All-Time High in 2026
Sam Altman’s ChatGPT AI predicts Bitcoin could reach a new all-time high in 2026, nearly doubling its October 2025 high of $126,00...

Meta AI Predicts This Huge Catalyst Could Lead to $40 XRP
Mark Zuckerberg’s Meta AI predicts an insanely wild bullish price target for XRP by January 1, 2027. The AI bot believes $25–$40 i...

What Is Crypto Spot Trading?
For example, a token can be up 70% and still be a terrible trade if you have no idea when to take profits. Likewise, a 30% dip can...

Most Tokenized Stock Trading Happens Outside U.S. Market Hours, IMF Finds
More than half of all trading in tokenized U.S. stocks happens while Wall Street is closed, according to new data from the Interna...
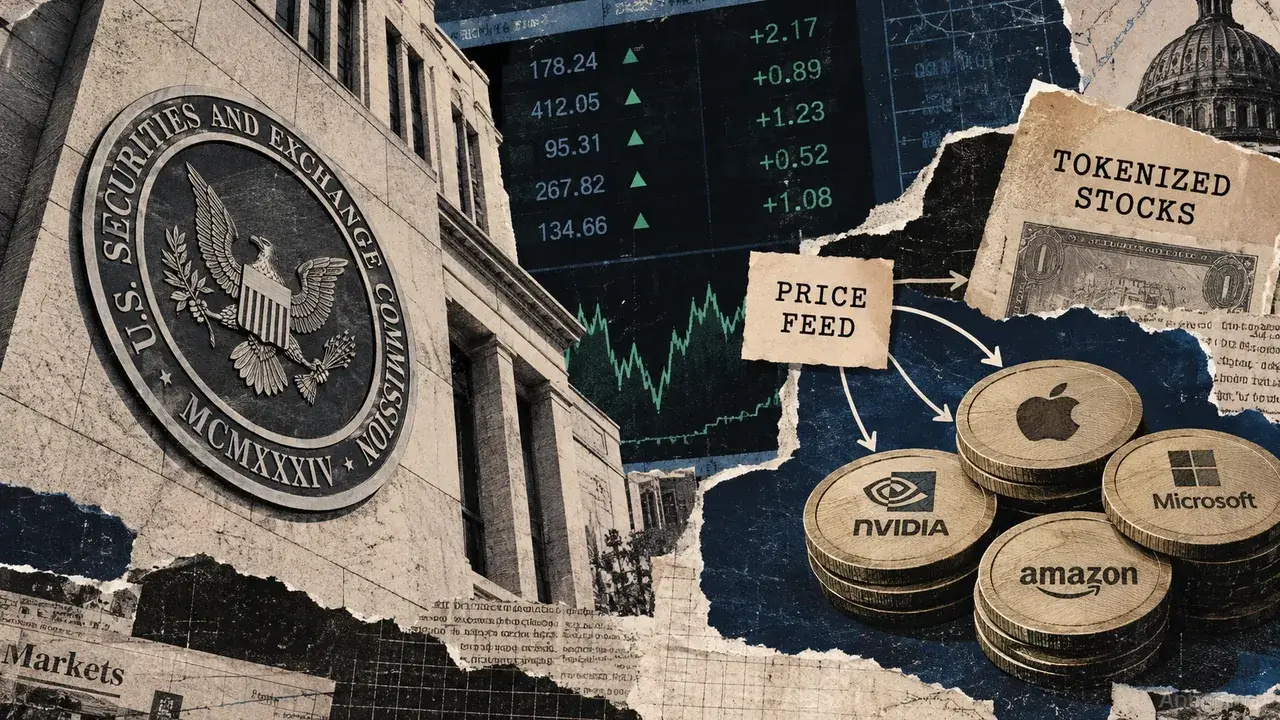
Tokenized stocks can carry the same rights without the same trading protections
Tokenized stocks eligible for the SEC’s September exemption must carry equivalent shareholder rights, yet their trading venues can...