XRP Flashes 3-Drive Reversal As Bulls Eye Explosive Break Above $2.50
XRP is testing a key inflection zone above $2.00 as two independent frameworks from crypto analysts Dom (@traderview2) and Osemka (@Osemka8) converge on a potential reversal – with clearly defined levels at roughly $2.00...
Archive context
Older archive item. Useful for background and entity history, but not a fresh market-moving signal.

XRP is testing a key inflection zone above $2.00 as two independent frameworks from crypto analysts Dom (@traderview2) and Osemka (@Osemka8) converge on a potential reversal – with clearly defined levels at roughly $2.00, $2.22 and $2.50 marking the battlefield.
XRP Price Consolidation Nears Its EndOn the higher-timeframe 2-day chart, Osemka frames the structure as a classic flat correction built on top of the 2021 high. “Here’s the range and levels to help you navigate it. We’re basing on top of 2021 high,” he writes, adding that “we’ve also never broken down after going sideways for this long, so I remain with my view of this being an accumulation range and a flat correction.”
His chart shows XRP oscillating in a horizontal band whose floor aligns with the 2021 high, labeled as a “Reaccumulation” area. Price has repeatedly tagged this support and bounced, while midrange resistance in the low-to-mid $2 zone has capped multiple rallies. Above, a higher horizontal line marks the January spike, which Osemka treats as the cycle top.
Internally, he maps an A–B–C corrective sequence. The B leg forms a dotted ascending channel, labeled as a 3-legged “abc” wave. “That dotted ascending range in the middle (3 legged abc wave in B) has me optimistic as that is a corrective move that is synonymous for a flat correction,” he explains. “Meaning the top was in January and this indeed is only a sideways correction.” The current C leg is contained within a downward “Corrective channel” pointing back toward the lower band.
For Osemka, even a deeper test of support would not necessarily be bearish for the larger structure: “If we end up taking the lower end of the range with C leg it’ll remain to be seen. But if so, it’d be a great buying opportunity.” He also calls XRP “a perfect example on why I view BTC also as a flat correction with the top in January,” arguing that “while Bitcoin is messy, XRP is very clean.”
Why Its Now Or Never For XRPDom zooms in on the last six weeks of that broader range and focuses on the microstructure that could trigger a move back toward the upper band. “If you inverse the chart over the last 6 weeks, you’ll see a perfect 3 drive pattern, a very accurate reversal setup in crypto,” he writes. On the non-inverted chart, this corresponds to three downside pushes that fail to extend lower, followed by what he calls a higher low: “We can see a HL has finally formed which can hint at the first sign of a trend change developing.”
His 8-hour chart highlights the monthly rolling VWAP as the key pivot. “Bulls needs to regain the monthly rVWAP around $2.22 and that would be the shift for a rally back towards ~$2.50,” Dom says. That ~$2.50 area aligns with higher VWAP clusters and the upper portion of Osemka’s range.
Order-book and skew data back his view that conditions are ripe for a break if buyers step in. “Orderbooks are clear, if there was a time, it’s now for this trend to shift,” he notes, pointing to relatively clean liquidity overhead and a recovering skew after a washed-out short side.
The downside is equally explicit: “If this setup fails, acceptance under $2 is next and the end of year is ugly.” That would mean a decisive loss of the long-defended support band built on the 2021 high and a deeper completion of the C leg in Osemka’s flat-correction structure.
For now, XRP remains compressed between the $2.00 support, the $2.22 monthly rVWAP trigger and the ~$2.50 upside magnet, with the six-week 3-drive pattern and flat-correction range jointly defining one of the clearest technical inflection points on the XRP chart this year.
At press time, XRP traded at $2.1798.
Why this matters
This altcoin story adds another data point to the current market tape and is useful when read alongside nearby source coverage.
Original source
Read on NewsBTCRelated market context
XRP Price Slid as Bitwise Drives $11 Million ETF Inflows
U.S. spot XRP ETFs drew $11.31 million in net inflows between October 5 and October 9, even as XRP fell from about $1.52 to $1.40...
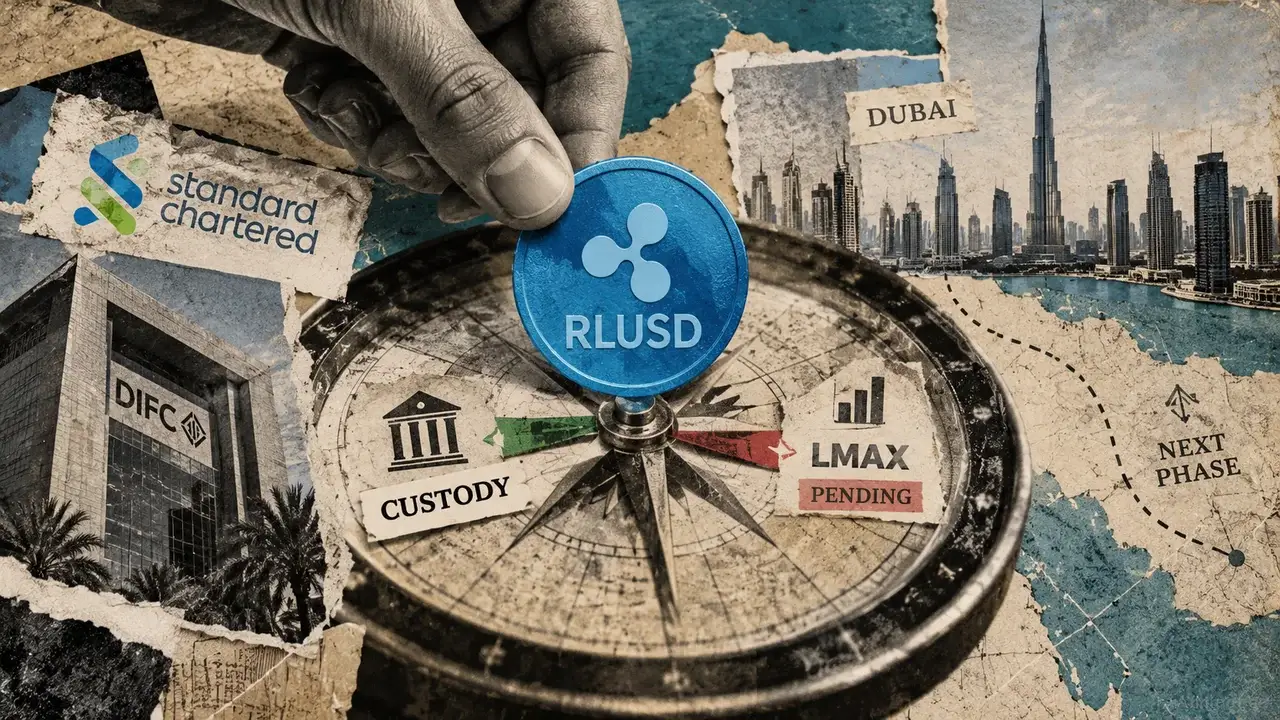
Standard Chartered brings Ripple’s RLUSD into banking custody after $765 million quarterly surge
Standard Chartered has launched custody for Ripple's RLUSD stablecoin as it prepares to expand its use as collateral for instituti...

China Crypto Strategy Expands as Beijing Backs National Blockchain Network
China announced crypto plans for a national blockchain network. The proposal appeared in a policy document from the Communist Part...

Meta AI Predicts 7-Figure BTC in 2026, But How?
Mark Zuckerberg’s Meta AI predicts that if a full-blown crypto bull market returns in Q4 and a landmark catalyst turbocharges it,...

State of TRON Q3 2026 Report Highlights $2.21 Trillion in Stablecoin Settlement Amid Network Activity Growth
Geneva, Switzerland, October 12, 2026 — TRON DAO, the community-governed DAO dedicated to accelerating the decentralization of the...

Anthropic’s Claude AI Predicts a Wild Price for Chainlink (LINK)
Anthropic’s Claude AI predicts that in a peak bull-market setup, Chainlink (LINK) could hit $150–$250 by January 1, 2027, with a s...