XRP Flashes Bullish Signal – Technical Indicator Hints At Imminent Rebound
XRP is holding above critical support levels after weeks of steady gains, but continues to face resistance below the $2.65 mark. Despite struggling to break higher, price action remains constructive, and traders are clos...
Archive context
Older archive item. Useful for background and entity history, but not a fresh market-moving signal.

XRP is holding above critical support levels after weeks of steady gains, but continues to face resistance below the $2.65 mark. Despite struggling to break higher, price action remains constructive, and traders are closely watching for signs of a breakout. The market appears to be coiling for a decisive move, with both bulls and bears awaiting confirmation.
Some analysts believe XRP is on the verge of a significant price surge, especially as broader market sentiment improves and Bitcoin stabilizes above key psychological levels. Top crypto analyst Ali Martinez added to this view by sharing a technical analysis that highlights a bullish setup emerging on XRP’s lower timeframes. A key indicator on the 1-hour chart has flashed multiple buy signals, typically associated with local bottoms and short-term rebounds.
This setup suggests growing momentum beneath the surface and strengthens the bullish outlook, at least in the short term. If bulls can push through the $2.65 resistance, XRP may open the door for a rally toward previous highs. For now, the focus remains on whether this technical signal translates into a breakout or if further consolidation is needed before the next major move.
XRP Builds Momentum On Lower TimeframesXRP is showing impressive resilience and remains one of the standout performers in the current market cycle. After a 50%+ rally from its April lows, XRP has retraced slightly from its local high near $2.80, yet continues to trade above key support levels. This retracement appears healthy given the scale of the recent move, and momentum remains firmly with the bulls, at least for now.
Market sentiment around XRP is split. Some analysts are calling for the beginning of a new bullish phase, with expectations of massive upside fueled by renewed altcoin strength and institutional interest. Others, however, warn that the current price action may be a temporary bounce within a broader bearish trend and caution that failure to reclaim higher resistance zones could lead to a sharp correction.
Despite the divided outlook, technical signals are leaning bullish in the short term. Martinez shared an update revealing that the TD Sequential indicator has printed multiple buy signals on XRP’s hourly chart. This tool is often used to identify trend reversals or continuation points, and in this case, it suggests that XRP could be gearing up for another leg higher.
If bulls can reclaim the $2.80 level and push beyond recent highs, XRP may ignite further upside momentum and test major resistance levels around $3.00 and beyond. For now, all eyes are on how the price reacts to short-term signals—particularly the buy zone identified by TD Sequential—which may dictate the next move in this critical phase of XRP’s market structure.
Price Analysis: Testing Key Support After Strong RallyXRP is currently consolidating around the $2.35 level after a strong rally earlier this month that saw the price surge to highs near $2.80. The chart shows that after reaching that local top, XRP has retraced but remains above its 200-day EMA ($2.04) and 200-day SMA ($2.18), both of which now act as dynamic support zones.
This pullback appears to be part of a healthy correction following the sharp run-up, and the structure still favors the bulls as long as XRP holds above $2.20. Price action shows a potential base forming around the $2.35 zone, with decreasing volatility suggesting that the market may be coiling for its next move.
Volume has slightly declined since the peak, hinting at temporary exhaustion from buyers, but the lack of heavy selling pressure indicates that most market participants are holding through the consolidation. A break above the $2.60–$2.65 range could open the door for a retest of the $2.80 resistance and potentially a breakout.
Featured image from Dall-E, chart from TradingView
Why this matters
This altcoin story adds another data point to the current market tape and is useful when read alongside nearby source coverage.
Original source
Read on NewsBTCRelated market context

Ethereum (ETH) Price Prediction: ETH Holds $2,400 Breakout as Bulls Target $2,600 and $2,823
Ethereum price has quietly worked its way back into an important part of the chart after a strong recovery from recent lows. The p...

XRP Price Prediction: Korea and Binance Power the Rally, But Can XRP Keep Going?
XRP is trading at a $1.40 price range after a run that saw the token outperform every other top-10 crypto asset by a wide predicti...

Bitcoin (BTC) Price Prediction: Hidden Weekly RSI Divergence Warns of Pullback as BTC Tests $80K
Bitcoin price was trading around $80,500 on Bitstamp in the latest technical reading, up 3.11% on the session. While the price rem...
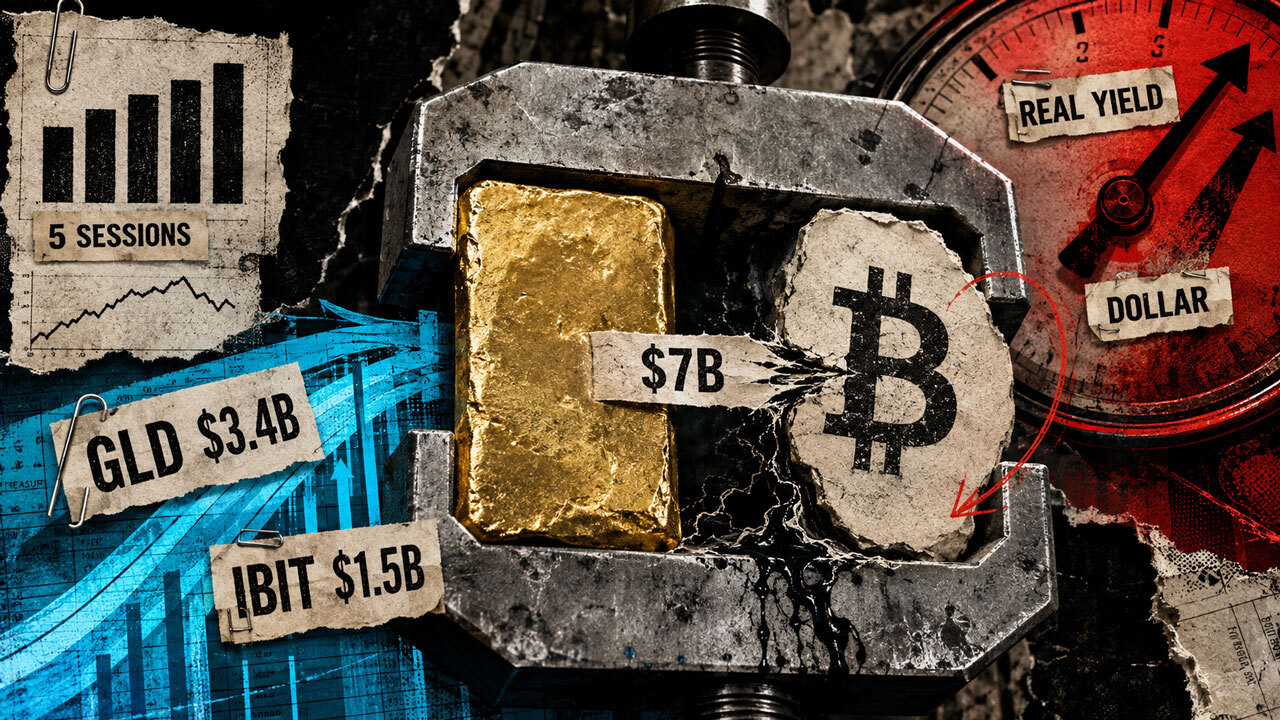
Investors just moved $7 billion into Bitcoin and gold in five days to escape an accelerating dollar crisis
Gold and Bitcoin exchange-traded funds (ETFs) drew roughly $7 billion over five US trading sessions, a record combined haul that p...

Morgan Stanley leads Solana ETF $9 million inflows as SOL jumps rises above $100
US Solana exchange-traded funds (ETFs) attracted about $9.1 million in net inflows on Aug. 26, led by Morgan Stanley’s MSOL. SoSoV...

Bitcoin Price Prediction: Can BTC Get Back Over $80,000?
Today’s Bitcoin price prediction has BTC trading at $79,500, up around +1.1% over the past 24 hours, as the coin’s late-August gri...