XRP Forms Bullish Flag Pattern: What’s Next For The Altcoin?
XRP is capturing attention across the crypto market as it forms a bullish flag pattern, a classic technical setup often signaling potential upside. This development comes after a strong price surge, followed by a period...
Archive context
Older archive item. Useful for background and entity history, but not a fresh market-moving signal.

XRP is capturing attention across the crypto market as it forms a bullish flag pattern, a classic technical setup often signaling potential upside. This development comes after a strong price surge, followed by a period of consolidation that mirrors the shape of a flag. Such patterns are typically interpreted as continuation signals, hinting that the recent upward momentum could resume if key conditions are met.
Currently trading within this flag’s boundaries, XRP appears to be gathering strength for its next big move. A successful breakout would likely validate the bullish scenario, positioning the altcoin for significant gains and sparking renewed optimism in the market. Conversely, a breakdown below the lower boundary could undermine hopes, paving the way for a possible retracement.
Analyzing The Bullish Flag: A Closer Look At XRP’s PatternThe bullish flag pattern is a reliable continuation signal in technical analysis, suggesting further upside potential. For XRP, this pattern has gained attention as it indicates the cryptocurrency may be preparing for its next upward move.
XRP’s price initially surges, creating a “flagpole” driven by strong positive momentum and high volume. Following this is a consolidation phase where the price moves within a narrow range, typically downward or sideways. This consolidation represents a temporary pause in the uptrend, allowing the market to digest gains. It demonstrates resilience, suggesting that selling pressure is manageable and the bullish trend could resume.
Furthermore, the formation is validated when the price breaks out above the upper boundary of the flag, resuming its prior upward trajectory. Such a breakout would signal renewed buying interest and the potential to test higher price levels.
Key indicators to watch include increased trading volume during the breakout as this confirms market participation and bullish conviction. Additionally, XRP must sustain its momentum above the resistance level to avoid the risk of a false breakout.
Key Resistance And Support Levels: Navigating The Breakout PotentialIf XRP’s price breaks out above the upper boundary of the bullish flag pattern, it could signal the continuation of the uptrend and open the door for a move toward higher price levels, with the next major resistance zone near $2.90. A successful breakout above this level would reinforce the upside trend, possibly leading to new price highs.
However, if XRP breaks below the lower boundary of the flag, the immediate support to watch is $1.90. A decisive break below this level could signal a shift in market sentiment, potentially leading to further downside movement. Such a breach would suggest that the bullish momentum has faltered, and the next support zone might be tested, which may trigger additional selling pressure.
Why this matters
This altcoin story adds another data point to the current market tape and is useful when read alongside nearby source coverage.
Original source
Read on NewsBTCRelated market context

Dogecoin (DOGE) Price Prediction: DOGE Holds Near $0.084 as $0.09 Breakout Could Open $0.115
Dogecoin is back in the spotlight as price slips towards the $0.084 area, putting an important support zone under pressure. The la...

XRP Price Targets $2 as One Key Metric Flashes Bullish Signal
XRP price is sitting in a corrective pocket after one of its stronger months of the year. That $2 target sounds ambitious given th...

Bitcoin (BTC) Price Today: Whale Buying Strengthens Bullish Case as BTC Consolidates Near $79K
At the same time, technical indicators show that the recent rally has become stretched, leaving Bitcoin price caught between a con...
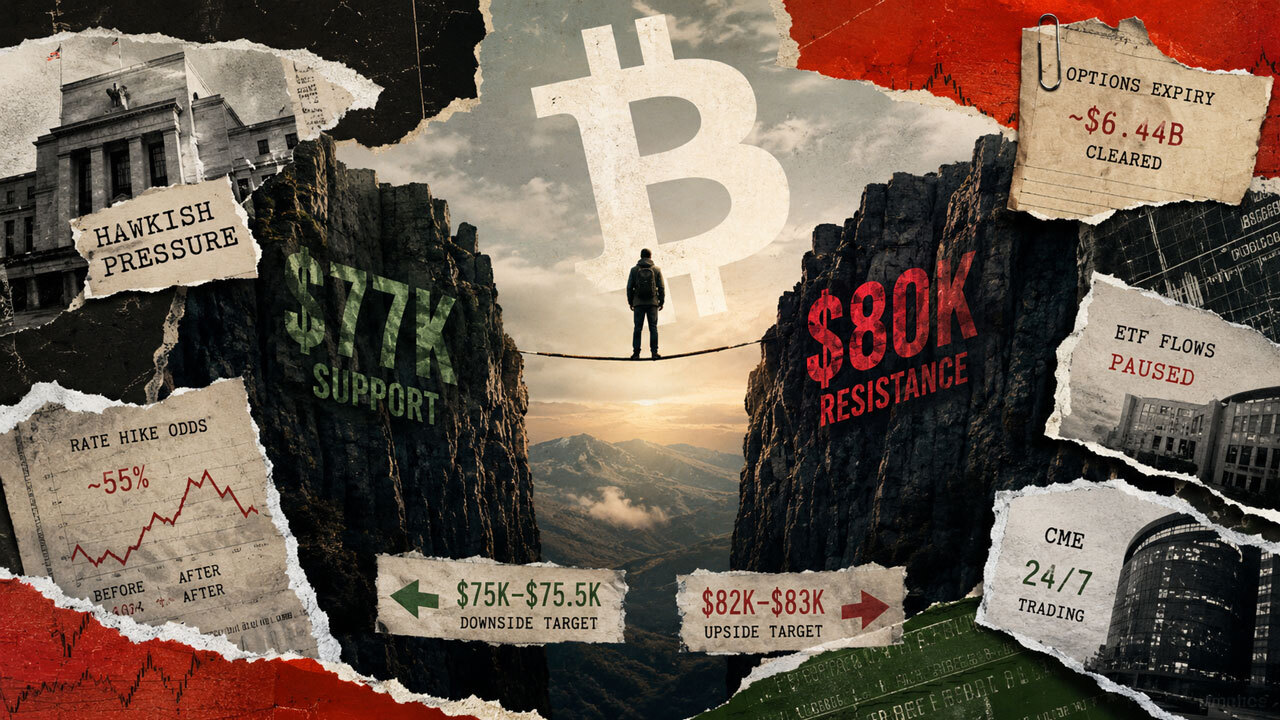
Bitcoin’s failed $81,000 breakout just put $75,000 back on the table
Bitcoin trades near $78,000 heading into the weekend, sitting almost between $77,000 support and $80,000 resistance after a sharp...

XRP Price Prediction: Momentum and $1.40 Floor to Hold
XRP price trades around the $1.40 to $1.45 range, down from the recent $1.70 peak as the token digests one of its sharpest weekly...

Sui (SUI) Price Prediction: ETF Inflows and 100MA Support Strengthen $1.15 Outlook
Recent SUI price action has focused attention on the $0.73-$0.76 area, where several short- and medium-term moving averages are pr...