XRP Maintains Support: Can It Rise Amid BTC and ETH Declines?
XRP price extended gains above the $0.6220 zone. The price tested the $0.6330 zone before there was a pullback amid declines in BTC and ETH. XRP price started a downside correction from the $0.6330 zone. The price is now...

XRP price extended gains above the $0.6220 zone. The price tested the $0.6330 zone before there was a pullback amid declines in BTC and ETH.
- XRP price started a downside correction from the $0.6330 zone.
- The price is now trading near $0.600 and the 100-hourly Simple Moving Average.
- There is a connecting bullish trend line forming with support at $0.5920 on the hourly chart of the XRP/USD pair (data source from Kraken).
- The pair could start another increase if it stays above the $0.590 support zone.
XRP price extended its increase above the $0.6150 resistance. It even climbed above the $0.6220 resistance before the bears appeared. A high was formed at $0.6330 before Bitcoin and Ethereum dragged the market lower.
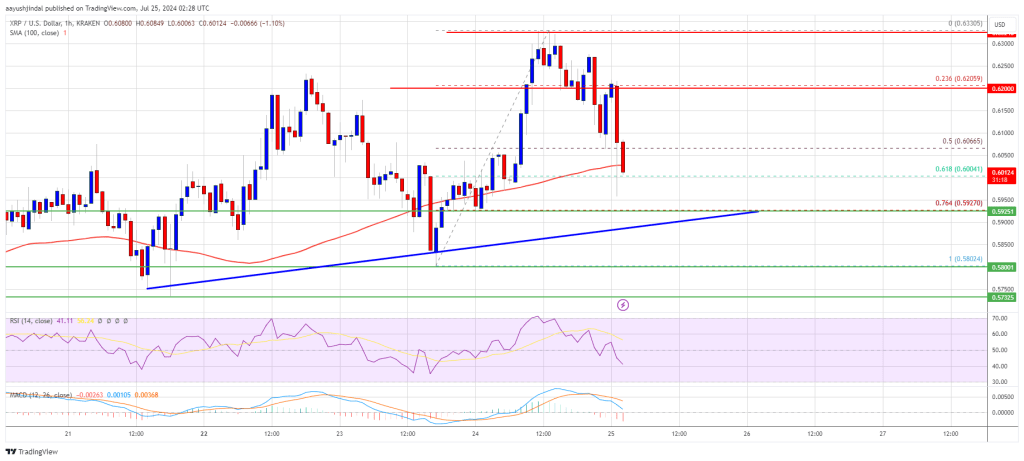
There was a move below the $0.6150 and $0.6120 levels. The price declined below the 50% Fib retracement level of the upward move from the $0.5802 swing low to the $0.6330 high. It is now trading near $0.600 and the 100-hourly Simple Moving Average.
There is also a connecting bullish trend line forming with support at $0.5920 on the hourly chart of the XRP/USD pair. The trend line is close to the 76.4% Fib retracement level of the upward move from the $0.5802 swing low to the $0.6330 high.
If there is a fresh upward move, the price could face resistance near the $0.6120 level. The first major resistance is near the $0.6200 level. The next key resistance could be $0.6220. A clear move above the $0.6220 resistance might send the price toward the $0.6350 resistance. The next major resistance is near the $0.6500 level. Any more gains might send the price toward the $0.680 resistance.
More Losses?If XRP fails to clear the $0.6120 resistance zone, it could continue to move down. Initial support on the downside is near the $0.5950 level. The next major support is at $0.5920 and the trend line zone.
If there is a downside break and a close below the $0.5920 level, the price might continue to decline toward the $0.580 support in the near term.
Technical Indicators
Hourly MACD – The MACD for XRP/USD is now gaining pace in the bearish zone.
Hourly RSI (Relative Strength Index) – The RSI for XRP/USD is now below the 50 level.
Major Support Levels – $0.5920 and $0.5800.
Major Resistance Levels – $0.6120 and $0.6220.
Original source
Read on NewsBTCRelated market context

Standard Chartered Says Bitcoin Bottomed Near $59,000 As Crypto Winter Ends
TL;DR Standard Chartered’s Geoffrey Kendrick reportedly says Bitcoin’s $59,000 area marked the cycle bottom. The note cites SpaceX...

Google Gemini AI Predicts Jaw-Dropping XRP Price For Next 90 Days
Google Gemini AI just put XRP back under the spotlight, predicting it is tightly wound for a major breakout toward $1.60 to $1.80...

Bitcoin price challenges $64,000 weekend wall – needing a breakout or risk a deeper correction
Bitcoin reclaimed $64,000 on June 12 and touched an intraday high of $64,301 in the same session that spot ETF flows finally flipp...

Elon Musk SpaceX AI Predicts Incredible Bitcoin Price For Next 30 Days
Here is the thing about capitulation calls. They only sound smart in hindsight. Right now, with Bitcoin price scraping along the l...

Bitcoin price faces new risk as big buyers lose conviction
Bitcoin’s largest buyers are no longer behaving like a reliable backstop for the largest cryptocurrency. The exchange-traded funds...

Bitcoin Mining Cost Model Points To $47,000 Floor, But Analysts Urge Caution
TL;DR Crypto Rover says Bitcoin has never bottomed below electrical production cost, currently estimated at $47,000. Mining-cost m...