XRP MVRV Ratio Flashes Signal That Last Led To 630% Surge
An analyst has pointed out that the XRP Market Value to Realized Value (MVRV) Ratio has just formed a crossover that proved to be highly bullish the last time it appeared. XRP MVRV Ratio Has Broken Above Its 200-Day MA I...
Archive context
Older archive item. Useful for background and entity history, but not a fresh market-moving signal.

An analyst has pointed out that the XRP Market Value to Realized Value (MVRV) Ratio has just formed a crossover that proved to be highly bullish the last time it appeared.
XRP MVRV Ratio Has Broken Above Its 200-Day MAIn a new post on X, analyst Ali Martinez has talked about a crossover that has recently occurred in the MVRV Ratio of XRP. The “MVRV Ratio” is a popular on-chain indicator that keeps track of the ratio between the asset’s Market Cap and Realized Cap.
The Realized Cap here refers to a capitalization model that calculates the cryptocurrency’s total value by assuming that the value of each coin in circulation is equal to the price at which it was last transacted on the blockchain. This is unlike the Market Cap, which simply takes the current spot price as the same one value for all coins.
The last transfer of any token is likely to represent the last time it changed hands, so the price at its time can be denoted as its current cost basis. As such, the Realized Cap represents the sum of the cost basis of the entire circulating supply.
One way to interpret the model is as a measure of the amount of capital that the investors as a whole have stored in the cryptocurrency. The Market Cap, on the other hand, signifies the value that the holders are carrying in the present.
When the value of the MVRV Ratio is more than 1, it means the Market Cap is greater than the Realized Cap. In other words, the investors are holding more than they put in. On the other hand, the metric being under this threshold suggests the overall network is underwater.
Now, here is the chart shared by Martinez that shows the trend in the XRP MVRV Ratio, as well as its 200-day moving average (MA), over the past year:
As displayed in the above graph, the XRP MVRV Ratio has seen a sharp surge recently as the asset’s breakout has occurred. With this uptrend, the indicator has managed to break past its 200-day MA.
In the chart, the analyst has highlighted the last time that the cryptocurrency’s MVRV Ratio and its 200-day MA showed this type of crossover. What followed back then was a significant bull run in which the coin managed to rise by around 630%.
Given this precedence, it now remains to be seen whether the latest crossover will also prove to be a golden one for XRP.
XRP PriceAt the time of writing, XRP is floating around $3.32, up 33% in the last seven days.
Why this matters
This altcoin story adds another data point to the current market tape and is useful when read alongside nearby source coverage.
Original source
Read on NewsBTCRelated market context

New SummerFi DeFi exploit shows AI automation now sits above smart contract risk
Summer.fi's automated vault incident has put delegated DeFi yield back under pressure after Blockaid said on July 6 that its explo...
Strategy faces $8.3 billion Bitcoin Q2 loss as Saylor sells over $200M in BTC
Strategy’s largest Bitcoin sale in years has put new pressure on the corporate treasury model that made Michael Saylor one of the...
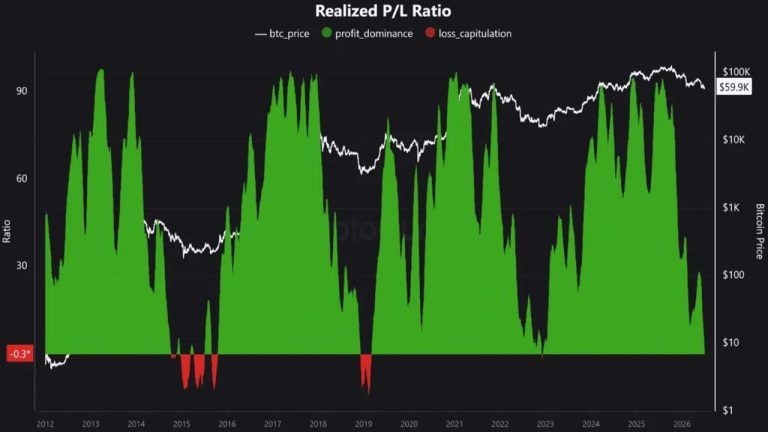
Bitcoin Bottom Signal Last Seen at FTX Collapse Flashes as Saylor’s Strategy Dumps 3,588 BTC
Bitcoin’s realized profit and loss ratio has fallen to -0.35, a 43-month low last seen after FTX’s collapse, flashing what Cryptoq...
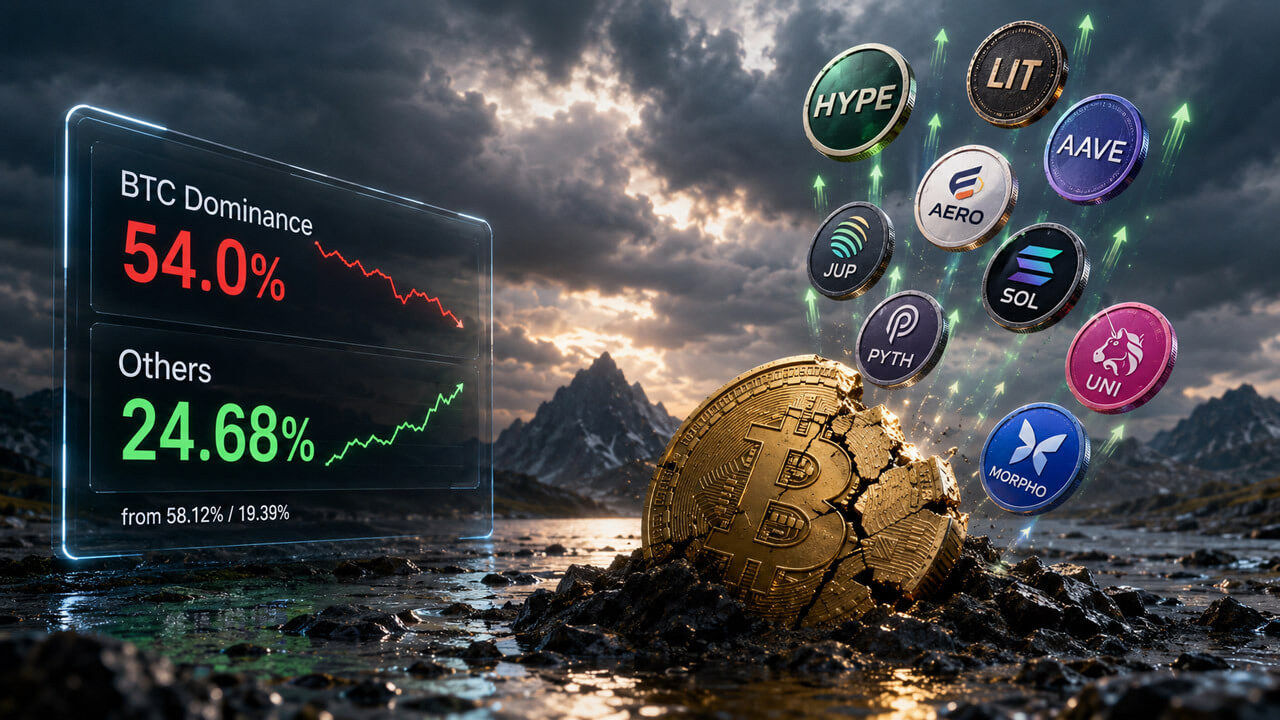
Bitcoin dominance hits one-month low as altcoin winners start breaking away
Bitcoin's dominance dropped to a one-month low of 54%, down from 58.12%, according to CoinGecko's dominance table. Over the same s...

Bitcoin price rebounds to $63K as leverage returns creating short term volatility risk
Bitcoin's rebound has cleared the first test: price recovered. The harder one starts now: proving buyers remain after the squeeze....
Newcastle United’s pursuit of Johan Manzambi sends his Sorare NFT values surging
The surge in Johan Manzambi's Sorare NFT values highlights the growing intersection of sports and digital assets, impacting invest...