XRP Path To A New All-Time High Is Playing Out Beautifully – Here’s How
XRP’s journey toward a new all-time high is shaping up with remarkable precision. After weeks of steady accumulation and shallow pullbacks, the chart is finally coming alive, and momentum is building fast. From key Fibon...
Archive context
Older archive item. Useful for background and entity history, but not a fresh market-moving signal.

XRP’s journey toward a new all-time high is shaping up with remarkable precision. After weeks of steady accumulation and shallow pullbacks, the chart is finally coming alive, and momentum is building fast. From key Fibonacci retracements to breakouts, everything is aligning for what could be XRP’s most exciting move yet. Here’s how it’s unfolding.
Shallow Pullbacks Signal Strength In XRP’s Bullish StructureCrypto Analyst CasiTrades revealed that XRP’s price pulled back to $2.85, which aligns with the 0.236 fib retracement level. This minor pullback follows a strong upward trend and suggests that the market may be cooling off before its next move higher.
According to the analyst, XRP “continues to hold bullish retrace levels, like .118 + .236.” CasiTrades stated that this is exactly what we want to see in bullish continuation, pointing to the shallow retracements as a sign of strength. The ability of XRP to maintain these support levels indicates that bulls remain in control and that momentum may soon return.
XRP is once again targeting a key level. As the analyst noted, “Now, XRP is making its way toward $3.04 again, the next macro resistance level.” This level represents a significant barrier, and reclaiming it could define the trajectory of the next major move. CasiTrades highlighted the potential for a breakout, saying that flipping this into support is the final major hurdle before entering price discovery, which could send XRP into uncharted territory.
Hourly Trendline Offers Clear Roadmap For XRP’s Next MoveCasiTrades went on to state that there’s a strong trendline forming on the hourly chart, a structure that’s proving valuable in monitoring support, resistance, and timing. This trendline is shaping market expectations and offers a technical roadmap for potential short-term movements.
Using this framework, the analyst suggests that “we should see a breakout to $3.18 today,” identifying it as a key resistance level across multiple timeframes. If confirmed, this projected move would be an incredibly bullish signal, hinting at renewed strength behind XRP’s price action.
However, in the event of a rejection at $3.18, CasiTrades notes that a back-test of $3.04 fib could follow. Based on the current trendline’s trajectory, this could happen through Friday, allowing for a potential pullback before a significant rally.
“Playing out the way I’ve described would be a strong signal that the market is ready to accelerate,” the analyst concluded. Should buying pressure persist and technical conditions align, XRP could begin a vertical expansion very soon, suggesting that a parabolic move may not be far off.
Why this matters
This altcoin story adds another data point to the current market tape and is useful when read alongside nearby source coverage.
Original source
Read on NewsBTCRelated market context
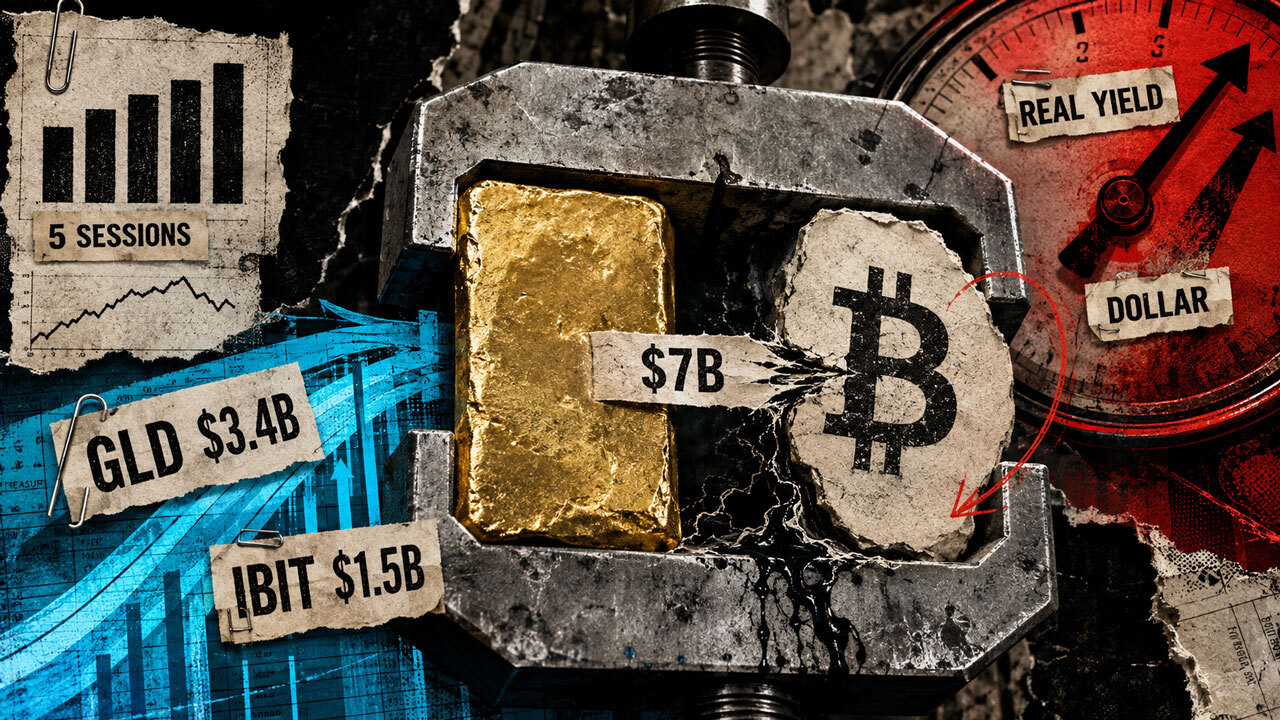
Investors just moved $7 billion into Bitcoin and gold in five days to escape an accelerating dollar crisis
Gold and Bitcoin exchange-traded funds (ETFs) drew roughly $7 billion over five US trading sessions, a record combined haul that p...
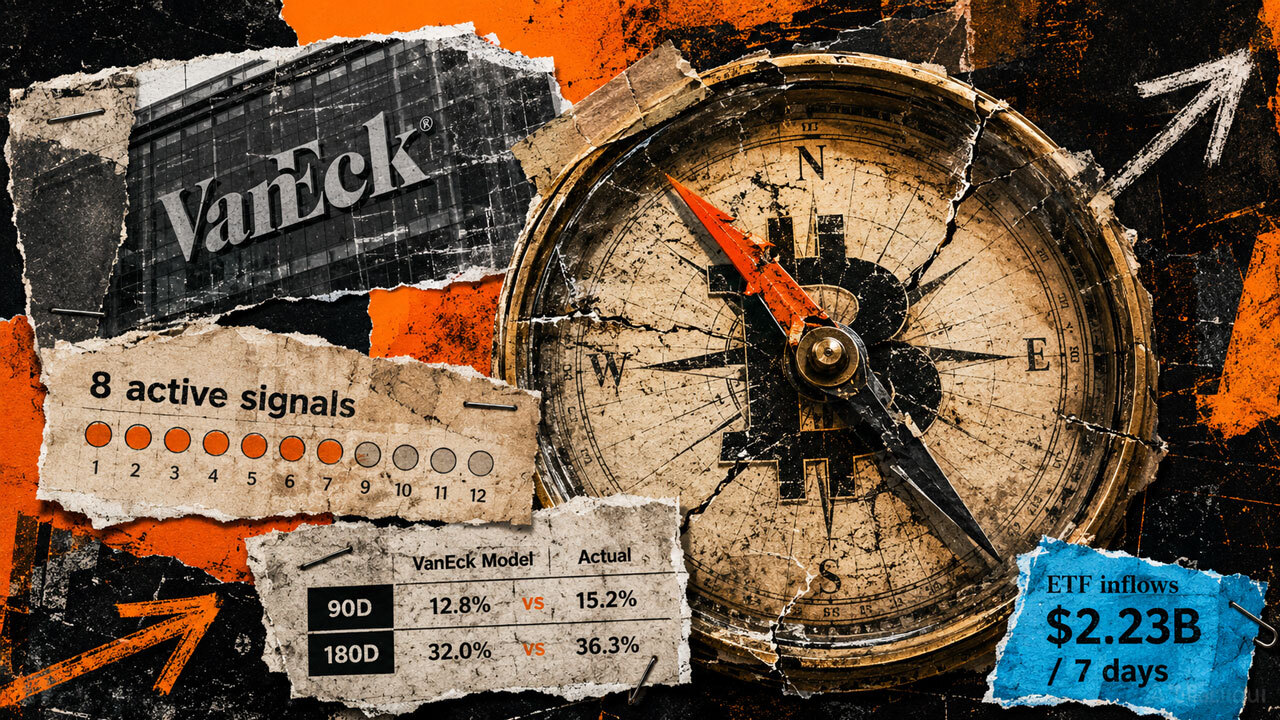
Bitcoin’s bottom signal is flashing, but six months of data shows a trap waiting for early buyers
Bitcoin’s late-August recovery has unfolded in stages. Days prior to the Aug. 19 pump, VanEck’s capitulation dashboard showed broa...

Bitcoin (BTC) Price Prediction: Hidden Weekly RSI Divergence Warns of Pullback as BTC Tests $80K
Bitcoin price was trading around $80,500 on Bitstamp in the latest technical reading, up 3.11% on the session. While the price rem...

Ethereum (ETH) Price Prediction: ETH Holds $2,400 Breakout as Bulls Target $2,600 and $2,823
Ethereum price has quietly worked its way back into an important part of the chart after a strong recovery from recent lows. The p...

Behind Bitcoin’s sudden resilience is a $2 billion cash surge that wiped out speculative leverage
July's PCE inflation reading held at 3.7% headline and 3.3% core on Aug. 26, both still above the Fed's target. Futures markets re...

Bitcoin Price Prediction: Can BTC Reclaim $80K This Week?
Bitcoin price prediction has the leading digital asset trading at $79,400, down -0.4% on the day, as the market digests a violent...