XRP Price Action Turns Bearish, Analyst Says Crash Below $1 Is Coming
XRP has struggled to maintain momentum over the past seven days and has had repeated failures to reclaim higher ground above $2.8. The weekly performance shows a decline of over 4%, and intraday movement in the past 24 h...
Archive context
Older archive item. Useful for background and entity history, but not a fresh market-moving signal.

XRP has struggled to maintain momentum over the past seven days and has had repeated failures to reclaim higher ground above $2.8. The weekly performance shows a decline of over 4%, and intraday movement in the past 24 hours has shown swings between $2.71 and $2.85.
This price movement is part of a selling pressure that has been building up since XRP lost its grip above $3 on August 28. Interestingly, a technical outlook suggests that this selling pressure might eventually cause XRP’s price action to crash down to $1.
Technical Analysis Points To BreakdownAlthough XRP is currently showing signs of exhaustion just below $3 after its rally in July and the first half of August, many analysts would argue that the rally is still on track to resume anytime soon. However, a technical analysis on the TradingView platform has outlined a distinctly extended bearish scenario for XRP based on its price movements on the three-day candlestick timeframe.
According to the chart, the crypto’s structure has shifted in favor of sellers after a rejection at $3. Short-lived rallies have failed to produce any significant higher highs on the 3-day candlestick, which has left the trend vulnerable to breakdowns to lower price zones. At the time of the analysis, XRP appeared to have already begun a significant decline from $2.8 and reached into the $2.7 zone.
As shown on the price chart above, as long as XRP’s price action is capped below $3, the selling pressure is likely to keep dominating. The projection shows extended downside moves that could send XRP closer to the $1 mark, with the imbalance from the late 2024 rally leaving few technical supports in between.
The charts highlight a broader bearish wave that could unfold across 2025 if current support levels fail. In such a situation, the token could not only slide below $2 but also risk plunging directly beneath $1 into the $0.70 to $0.50 price range.
This bearish target aligns with the imbalance block that was left behind during XRP’s near-vertical rise earlier in the cycle. Revisiting this level could serve to restore market equilibrium before any chance of a meaningful long-term recovery.
XRP’s Price ActionAt the time of writing, XRP is trading at $2.82, down by 0.5% and 4.4% in the past 24 hours and seven days, respectively. This drop is part of a broader crypto market pullback amid the most recent Personal Consumption Expenditures (PCE) Index data, which has created some uncertainty over US interest rate cut expectations. However, trading volume and volatility are still high, and XRP has managed to rebound by 4% from its intraday low of $2.71.
For now, the outlook is whether XRP can hold its ground above $2.7 or if this bearish structure will transform into the crash scenario forecasted by the analyst.
Why this matters
This altcoin story adds another data point to the current market tape and is useful when read alongside nearby source coverage.
Original source
Read on NewsBTCRelated market context

Why Bitcoin’s $80,000 rally just flipped from short squeeze to long squeeze
Bitcoin's brief pullback below $78,000 triggered more than $300 million in crypto liquidations as traders took profits after a sha...

XRP Price Analysis: Where Will Ripple Token Go Next?
XRP is trading at $1.43 as the token settles into a tight range after last week’s fireworks. The bigger number nobody’s talking ab...

XRP Soars, But What’s Really Happening? Can Ripple Blast Past $10 This Year?
XRP is trading at $1.41, down 2% over the past 24 hours in a mild pullback after one of the sharpest weekly moves in the top-10. T...

Hyperliquid (HYPE) Price Prediction: Ascending Triangle Breakout Could Open Path Toward $90
HYPE Price was trading around $81.38 on August 26, while its recent all-time high stands at $83.27, according to Bybit data source...

Bitcoin (BTC) Price Prediction: $80K Breakout Sets Sights on New Upside Targets as Bullish Wave 3 Emerges
The move has placed the Bitcoin price back at a key technical level, while renewed spot demand and stronger exchange-traded fund (...
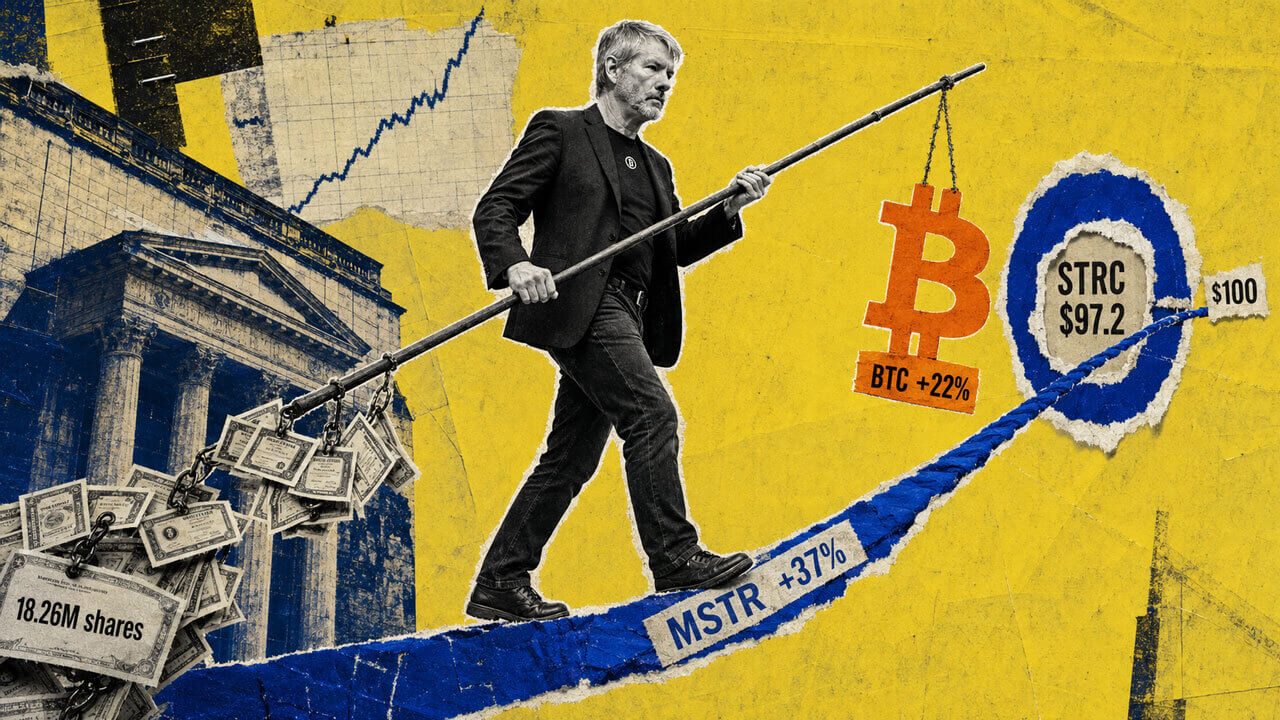
Strategy’s MSTR quietly outperforms Bitcoin’s $80,000 rally as STRC closes in on $100
Bitcoin's sharp two-week recovery, which briefly pushed its value above $80,000, has brought Michael Saylor's Strategy BTC treasur...