XRP Price Aims for a Bullish Surge: Is a Major Move on the Horizon?
XRP price is slowly moving higher above the $0.5120 zone. It could start a major increase if there is a close above the $0.5320 resistance zone. XRP is attempting a fresh increase above the $0.5220 zone. The price is now...

XRP price is slowly moving higher above the $0.5120 zone. It could start a major increase if there is a close above the $0.5320 resistance zone.
- XRP is attempting a fresh increase above the $0.5220 zone.
- The price is now trading above $0.520 and the 100-hourly Simple Moving Average.
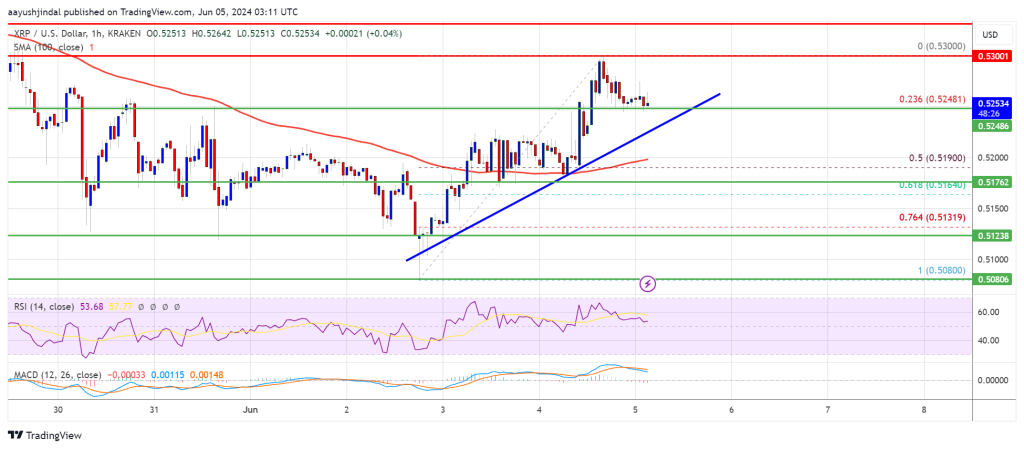
- There is a connecting bullish trend line forming with support at $0.5240 on the hourly chart of the XRP/USD pair (data source from Kraken).
- The pair could start a decent increase if there is a clear move above $0.5300.
XRP price remained well-supported above the $0.500 zone and started a fresh increase like Bitcoin and Ethereum. The price was able to clear the $0.5120 and $0.5150 levels.
There was a clear move above the $0.5250 resistance and the price tested the $0.530 zone. A high was formed at $0.5300 and the price is now consolidating gains above the 23.6% Fib retracement level of the upward move from the $0.5080 swing low to the $0.5300 high.
The price is now trading above $0.5250 and the 100-hourly Simple Moving Average. There is also a connecting bullish trend line forming with support at $0.5240 on the hourly chart of the XRP/USD pair.
On the upside, the price is facing resistance near the $0.5280 level. The first key resistance is near $0.5300. The next major resistance is near the $0.5320 level. A close above the $0.5320 resistance zone could send the price higher. The next key resistance is near $0.5450.
If there is a close above the $0.5450 resistance level, there could be a steady increase toward the $0.5560 resistance. Any more gains might send the price toward the $0.5650 resistance.
Another Decline?If XRP fails to clear the $0.530 resistance zone, it could start another decline. Initial support on the downside is near the $0.5240 level and the trend line.
The next major support is at $0.5190 or the 50% Fib retracement level of the upward move from the $0.5080 swing low to the $0.5300 high. If there is a downside break and a close below the $0.5190 level, the price might accelerate lower. In the stated case, the price could decline and retest the $0.5120 support in the near term.
Technical Indicators
Hourly MACD – The MACD for XRP/USD is now losing pace in the bullish zone.
Hourly RSI (Relative Strength Index) – The RSI for XRP/USD is now above the 50 level.
Major Support Levels – $0.5240 and $0.5190.
Major Resistance Levels – $0.5300 and $0.5320.
Original source
Read on NewsBTCRelated market context

Standard Chartered Says Bitcoin Bottomed Near $59,000 As Crypto Winter Ends
TL;DR Standard Chartered’s Geoffrey Kendrick reportedly says Bitcoin’s $59,000 area marked the cycle bottom. The note cites SpaceX...

Google Gemini AI Predicts Jaw-Dropping XRP Price For Next 90 Days
Google Gemini AI just put XRP back under the spotlight, predicting it is tightly wound for a major breakout toward $1.60 to $1.80...

Bitcoin Mining Cost Model Points To $47,000 Floor, But Analysts Urge Caution
TL;DR Crypto Rover says Bitcoin has never bottomed below electrical production cost, currently estimated at $47,000. Mining-cost m...

Tether USDT Briefly Overtakes Ethereum in Market Cap: A $187B Wake-Up Call
For a few hours, earlier this week, Tether USDT stablecoin held a higher market cap than Ethereum, the first time that has happene...

Bitcoin price challenges $64,000 weekend wall – needing a breakout or risk a deeper correction
Bitcoin reclaimed $64,000 on June 12 and touched an intraday high of $64,301 in the same session that spot ETF flows finally flipp...

Bitcoin rises above $64,000 after Pakistan prime minister says Iran peace deal is near
Bitcoin traded above $64,000 on Saturday, supported by its strongest ETF inflows in a month and growing optimism around geopolitic...