XRP Price Alert: Breakout Could Confirm Today
The XRP price has been in a downtrend since mid-November 2023. However, the XRP bulls seem to be taking control again if the following happens. An analysis of the 1-day chart of XRP/USD reveals that a potential price bre...
Archive context
Older archive item. Useful for background and entity history, but not a fresh market-moving signal.

The XRP price has been in a downtrend since mid-November 2023. However, the XRP bulls seem to be taking control again if the following happens. An analysis of the 1-day chart of XRP/USD reveals that a potential price breakout is imminent.
As of February 15, 2024, the price indicates an uptick in bullish momentum, with the pair currently trading at $0.55335, marking a 4.1% increase in the last 24 hours. A closer inspection reveals that XRP is challenging two critical resistance levels.
XRP Price Needs To Break These LevelsFirst, the Fibonacci retracement levels, drawn from the swing high at approximately $0.74854 to the swing low at $0.43085, show that the XRP price is currently facing the 0.618 level at $0.55221, which is a notable level for traders as it often acts as a pivot in market sentiment. XRP’s push through this level could indicate a shift towards a bullish outlook.
Second, the 1-day chart also features a descending channel pattern, which began forming in early-December 2023. The upper boundary of this channel has been tested multiple times, and the current price action is once again approaching this boundary. A definitive breakout above this descending channel could signal a trend reversal.
For this to happen, the XRP price needs to break above the $0.55 mark, which coincides with the 0.618 Fibonacci level. Adding to the bullish narrative, the Exponential Moving Averages (EMAs) show a potential bullish crossover in progress. The EMA 20 (red line) at $0.52865 is trending upwards, suggesting short-term momentum is gaining.
The EMA 50 (orange line) and EMA 100 (green line) are positioned at $0.54761 and $0.56331 respectively, with the EMA 200 (blue line) at $0.55985, serving as a long-term momentum indicator. A break above this cluster of EMAs, especially the 200-day EMA aka “bull line” could add to the bullish arguments.
Notably, volume levels have been moderate, and the Volume Oscillator does not show any abnormal spikes, indicating that the current price increase is not yet backed by significant trading volume. This could suggest that the breakout, if it occurs, may need to be confirmed with higher volume to sustain the move.
The Relative Strength Index (RSI) is at 59.62, which is below the overbought threshold of 70, indicating that there is still room for upward movement before the asset is considered overbought.
Breakout Confirmation Today?Overall, traders need to keep a close eye on whether the XRP price can sustain its movement above the $0.55 to $0.56 range. If this is accompanied by an increase in volume, it could confirm the breakout from the descending channel and possibly lead to a new uptrend.
Given the current technical setup, today’s trading session is crucial for determining the short-term direction of XRP. If XRP closes above the 0.618 Fib, descending channel as well as 200-day EMA, the bulls could finally be back.
Why this matters
This altcoin story adds another data point to the current market tape and is useful when read alongside nearby source coverage.
Original source
Read on NewsBTCRelated market context

Bitcoin (BTC) Price Prediction: BTC Turns $79K into Support as Risk-On Signal Points to Fresh Rally Toward $100K
The move has also coincided with a shift in Glassnode’s Bitcoin Vector framework. The proprietary model moved into a Risk-On regim...
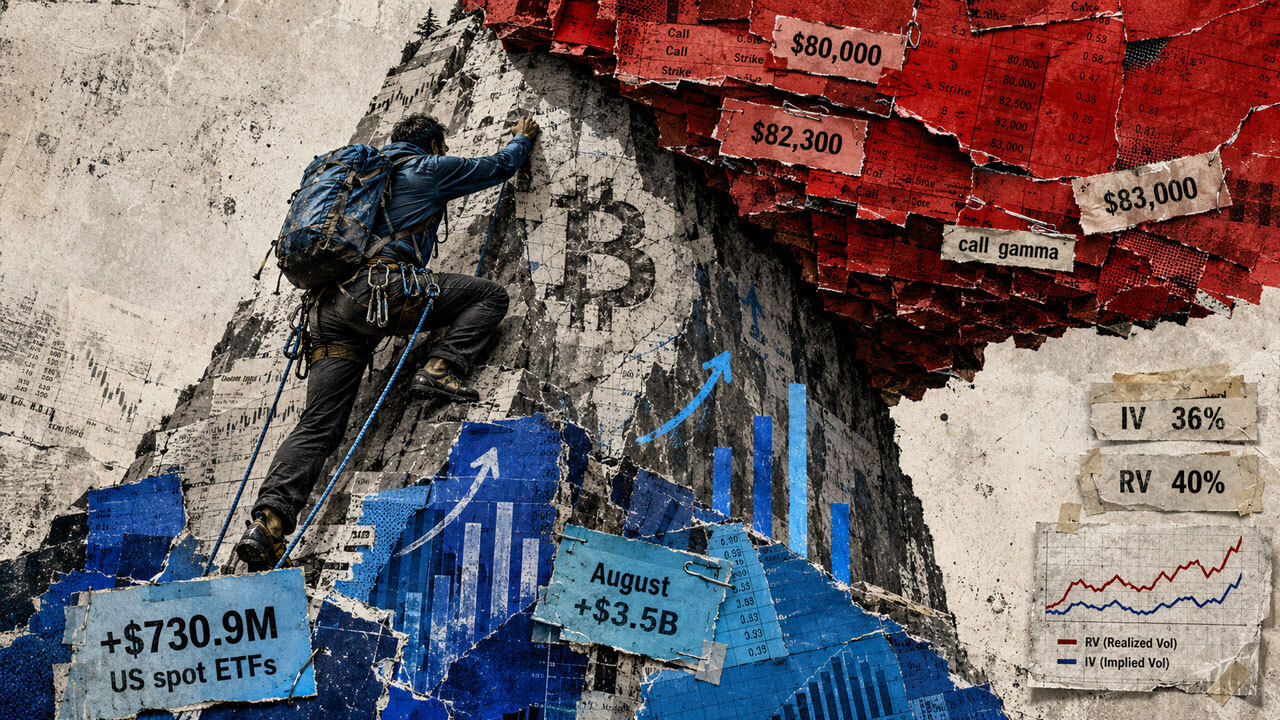
Bitcoin’s rally over $81,000 is finding real buyers, but options traders still aren’t pricing a clean breakout
Bitcoin accelerated above $81,000 on Thursday as easing rate fears and fresh institutional demand lifted the broader crypto market...

XRP News: Ripple Rallies on Fed Dovish Tone, $10 Dream Returns
XRP is back at $1.45, having a violent 6% rally on the Fed news, so is the whole crypto market. The run is strengthening the bigge...

Ethereum News: Double Three Pattern Hints at Another Rally
Ethereum trades at $2,520, sitting right at the pivot point most analysts have flagged in news outlets for weeks. That’s not a coi...

How the “buy, borrow, die” tax trade is quietly loading DeFi pools with hidden credit risk
Imagine someone who bought ETH for $1,000, watched it climb to $4,000, and now wants to cash out $1,000. Selling one-quarter of th...

ETH Price Prediction 2027, 2030, 2040: Could it Reach $4,965? Analysing the Potential of Ethereum, Bitcoin, and Apeing’s Upcoming Crypto Presale
On the other hand, Apeing is gaining attention as its planned September 8, 2026 presale approaches. Both these projects sit at ver...