XRP Price at Risk: Will It Sink or Swim at Key Support Levels?
XRP price is moving lower below $0.5350 support zone. It is now testing key support at $0.5220 and remains at risk of more downsides. XRP is struggling to gain bullish momentum above the $0.5350 resistance zone. The pric...

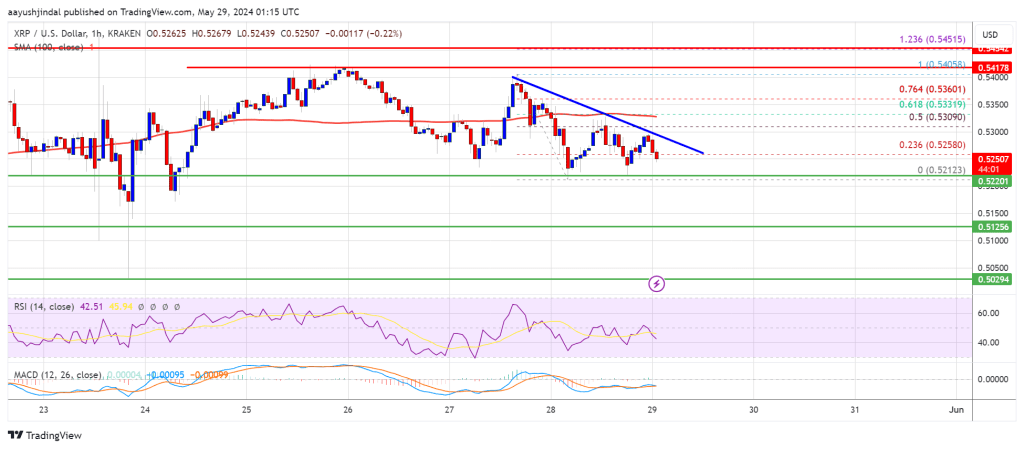
XRP price is moving lower below $0.5350 support zone. It is now testing key support at $0.5220 and remains at risk of more downsides.
- XRP is struggling to gain bullish momentum above the $0.5350 resistance zone.
- The price is now trading below $0.530 and the 100-hourly Simple Moving Average.
- There is a connecting bearish trend line forming with resistance near $0.5265 on the hourly chart of the XRP/USD pair (data source from Kraken).
- The pair could start a fresh increase unless the bears push the price below $0.5220.
In the past two sessions, XRP price saw a bearish move below the $0.5320 zone like Bitcoin and Ethereum. The price declined below the $0.5250 support zone before the bulls emerged.
A low was formed at $0.5212 and the price is now consolidating losses. It made a recovery attempt above the 23.6% Fib retracement level of the downward move from the $0.5405 swing high to the $0.5212 low. However, the bears are active near the $0.5300 zone.
There is also a connecting bearish trend line forming with resistance near $0.5265 on the hourly chart of the XRP/USD pair. The price is now trading below $0.530 and the 100-hourly Simple Moving Average.
Immediate resistance is near the $0.5265 level. The first key resistance is near $0.5320 or the 61.8% Fib retracement level of the downward move from the $0.5405 swing high to the $0.5212 low. A close above the $0.5320 resistance zone could send the price higher. The next key resistance is near $0.540.
If there is a close above the $0.540 resistance level, there could be a steady increase toward the $0.5450 resistance. Any more gains might send the price toward the $0.5650 resistance.
More Downsides?If XRP fails to clear the $0.5320 resistance zone, it could continue to move down. Initial support on the downside is near the $0.5220 level.
The next major support is at $0.5120. If there is a downside break and a close below the $0.5120 level, the price might gain bearish momentum. In the stated case, the price could decline and retest the $0.50 support in the near term.
Technical Indicators
Hourly MACD – The MACD for XRP/USD is now gaining pace in the bearish zone.
Hourly RSI (Relative Strength Index) – The RSI for XRP/USD is now below the 50 level.
Major Support Levels – $0.5220 and $0.5120.
Major Resistance Levels – $0.530 and $0.5320.
Original source
Read on NewsBTCRelated market context

Standard Chartered Says Bitcoin Bottomed Near $59,000 As Crypto Winter Ends
TL;DR Standard Chartered’s Geoffrey Kendrick reportedly says Bitcoin’s $59,000 area marked the cycle bottom. The note cites SpaceX...

XRP aims for $0.90 as ETF demand battles selling pressure from whales
XRP is trading at $1.11, down roughly 17% from its June opening, having set a new 2026 low on June 5 and shed $8 billion in market...

Tether USDT Briefly Overtakes Ethereum in Market Cap: A $187B Wake-Up Call
For a few hours, earlier this week, Tether USDT stablecoin held a higher market cap than Ethereum, the first time that has happene...

Google Gemini AI Predicts Jaw-Dropping XRP Price For Next 90 Days
Google Gemini AI just put XRP back under the spotlight, predicting it is tightly wound for a major breakout toward $1.60 to $1.80...

Bitcoin price challenges $64,000 weekend wall – needing a breakout or risk a deeper correction
Bitcoin reclaimed $64,000 on June 12 and touched an intraday high of $64,301 in the same session that spot ETF flows finally flipp...

Bitcoin rises above $64,000 after Pakistan prime minister says Iran peace deal is near
Bitcoin traded above $64,000 on Saturday, supported by its strongest ETF inflows in a month and growing optimism around geopolitic...