XRP Price Breaks Out and Surges: Will the Momentum Last?
XRP price rallied above the $0.5550 and $0.560 levels. It is now consolidating gains above $0.550 and might aim for more gains in the near term. XRP price gained pace for a move above the $0.550 resistance zone. The pric...

XRP price rallied above the $0.5550 and $0.560 levels. It is now consolidating gains above $0.550 and might aim for more gains in the near term.
- XRP price gained pace for a move above the $0.550 resistance zone.
- The price is now trading above $0.550 and the 100-hourly Simple Moving Average.
- There is a new connecting bullish trend line forming with support at $0.550 on the hourly chart of the XRP/USD pair (data source from Kraken).
- The pair could regain traction if it stays above the $0.550 pivot level.
XRP price remained well-supported above the $0.5320 level like Bitcoin and Ethereum. The price started a fresh increase and was able to clear the key hurdle at $0.5420.
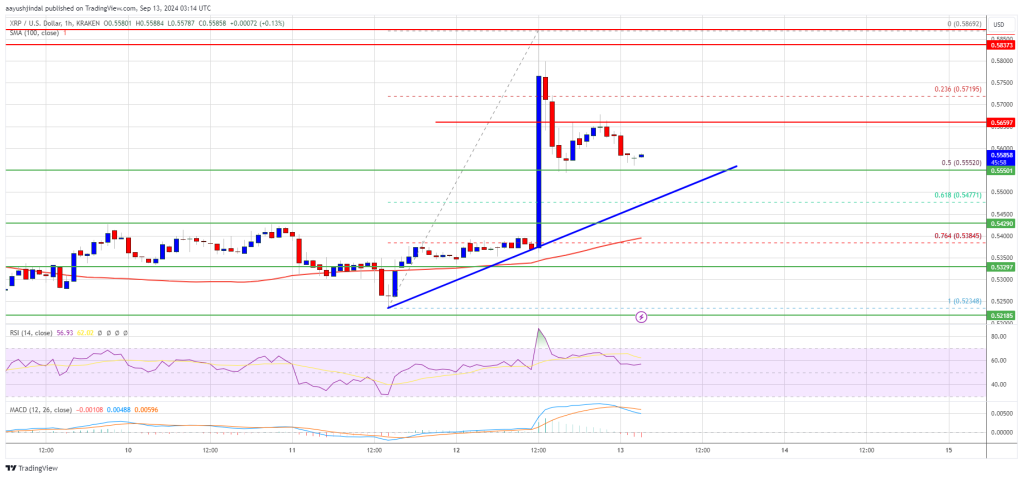
There was a surge above the $0.5550 and $0.5650 levels. The price even tested the $0.5870 zone. A high was formed at $0.5869 and the price started a sharp pullback. There was a move below the $0.5720 level. The price dipped below the 23.6% Fib retracement level of the upward move from the $0.5234 swing low to the $0.5869 high.
The price is now trading above $0.550 and the 100-hourly Simple Moving Average. There is also a new connecting bullish trend line forming with support at $0.550 on the hourly chart of the XRP/USD pair. The trend line is close to the 50% Fib retracement level of the upward move from the $0.5234 swing low to the $0.5869 high.
On the upside, the price might face resistance near the $0.5660 level. The first major resistance is near the $0.5720 level. The next key resistance could be $0.5850. A clear move above the $0.5850 resistance might send the price toward the $0.5920 resistance.
The next major resistance is near the $0.600 level. Any more gains might send the price toward the $0.6050 resistance or even $0.6120 in the near term.
More Downsides?If XRP fails to clear the $0.5660 resistance zone, it could start another decline. Initial support on the downside is near the $0.5550 level. The next major support is $0.5500.
If there is a downside break and a close below the $0.5500 level, the price might continue to decline toward the $0.5380 support in the near term. The next major support sits at $0.5250.
Technical Indicators
Hourly MACD – The MACD for XRP/USD is now losing pace in the bullish zone.
Hourly RSI (Relative Strength Index) – The RSI for XRP/USD is now above the 50 level.
Major Support Levels – $0.5550 and $0.5500.
Major Resistance Levels – $0.5660 and $0.5720.
Original source
Read on NewsBTCRelated market context

Standard Chartered Says Bitcoin Bottomed Near $59,000 As Crypto Winter Ends
TL;DR Standard Chartered’s Geoffrey Kendrick reportedly says Bitcoin’s $59,000 area marked the cycle bottom. The note cites SpaceX...

Google Gemini AI Predicts Jaw-Dropping XRP Price For Next 90 Days
Google Gemini AI just put XRP back under the spotlight, predicting it is tightly wound for a major breakout toward $1.60 to $1.80...

Bitcoin rises above $64,000 after Pakistan prime minister says Iran peace deal is near
Bitcoin traded above $64,000 on Saturday, supported by its strongest ETF inflows in a month and growing optimism around geopolitic...

Bitcoin price faces new risk as big buyers lose conviction
Bitcoin’s largest buyers are no longer behaving like a reliable backstop for the largest cryptocurrency. The exchange-traded funds...

Bitcoin price challenges $64,000 weekend wall – needing a breakout or risk a deeper correction
Bitcoin reclaimed $64,000 on June 12 and touched an intraday high of $64,301 in the same session that spot ETF flows finally flipp...

Elon Musk SpaceX AI Predicts Incredible Bitcoin Price For Next 30 Days
Here is the thing about capitulation calls. They only sound smart in hindsight. Right now, with Bitcoin price scraping along the l...