XRP Price Builds a Base: Can Bulls Ignite a New Rally?
XRP price surged further above the $1.45 and $1.50 resistance levels. The price is now consolidating gains near $1.40 and might aim for more upsides. XRP price started a fresh surge above the $1.40 resistance level. The...

XRP price surged further above the $1.45 and $1.50 resistance levels. The price is now consolidating gains near $1.40 and might aim for more upsides.
- XRP price started a fresh surge above the $1.40 resistance level.
- The price is now trading above $1.350 and the 100-hourly Simple Moving Average.
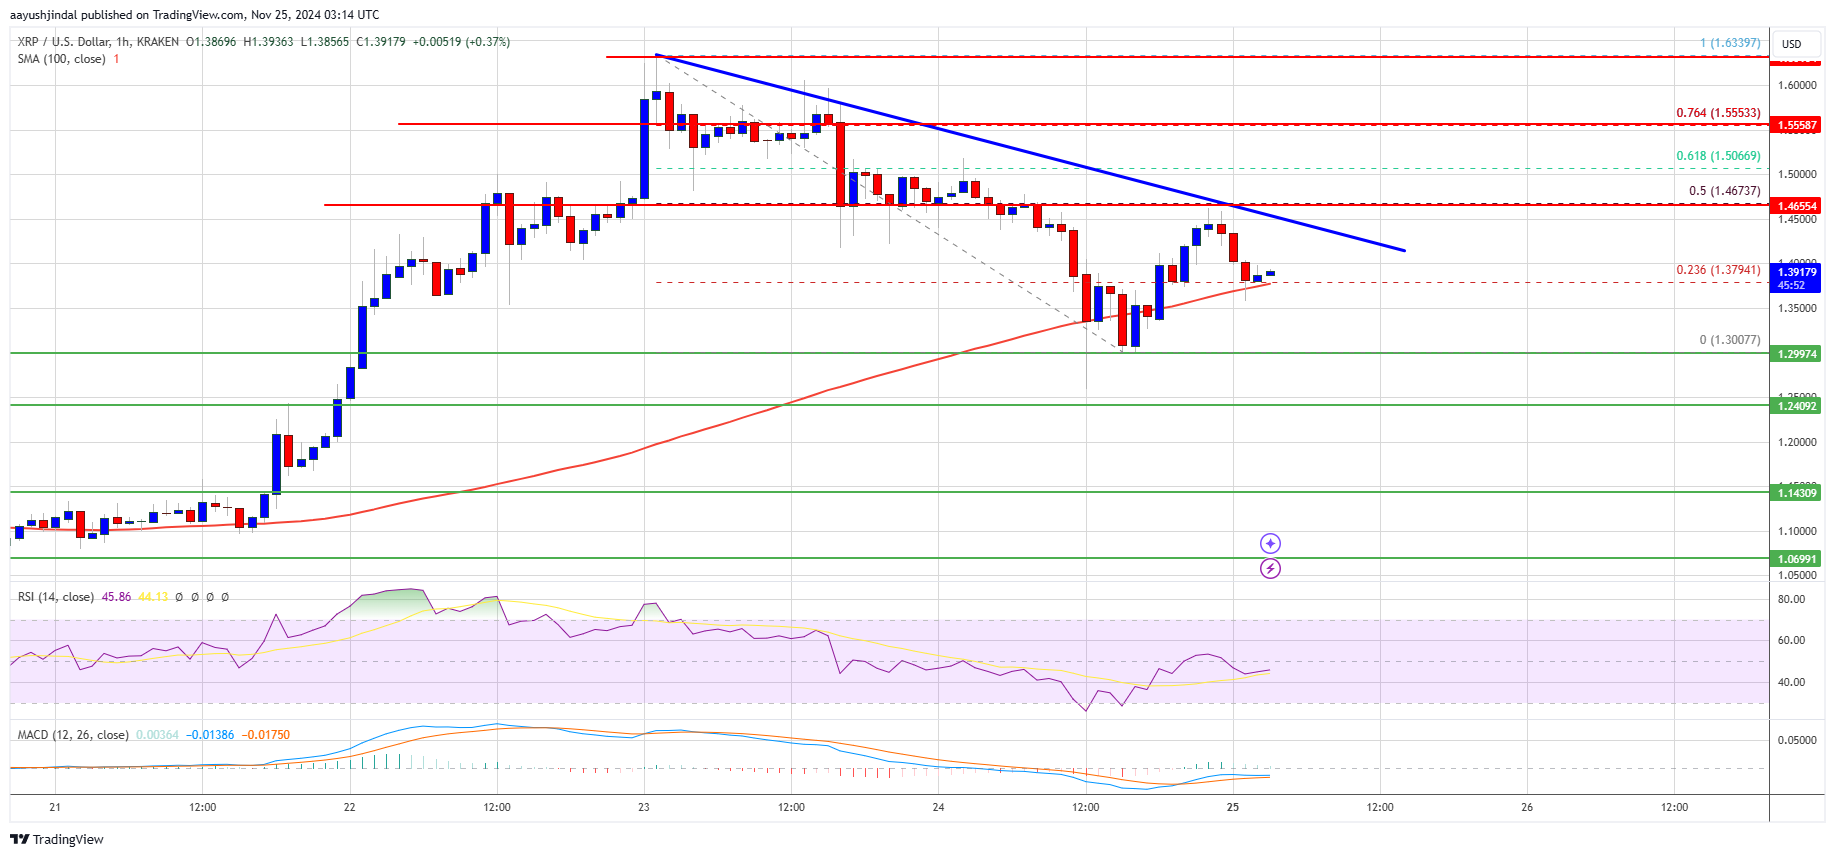
- There is a new connecting bearish trend line forming with resistance at $1.450 on the hourly chart of the XRP/USD pair (data source from Kraken).
- The pair is showing positive signs and might extend its rally above the $1.450 resistance.
XRP price formed a base above $1.250 and started a fresh increase. There was a move above the $1.350 and $1.40 resistance levels. It even pumped above the $1.50 level, beating Ethereum and Bitcoin in the past two days.
A high was formed at $1.6339 before there was a pullback. The price dipped below the $1.50 support level. A low was formed at $1.3007 and the price is now rising. There was a move above the 23.6% Fib retracement level of the downward move from the $1.6339 swing high to the $1.3007 low.
The price is now trading above $1.40 and the 100-hourly Simple Moving Average. On the upside, the price might face resistance near the $1.420 level. The first major resistance is near the $1.450 level.
There is also a new connecting bearish trend line forming with resistance at $1.450 on the hourly chart of the XRP/USD pair. It is close to the 50% Fib retracement level of the downward move from the $1.6339 swing high to the $1.3007 low.
The next key resistance could be $1.500. A clear move above the $1.50 resistance might send the price toward the $1.5550 resistance. Any more gains might send the price toward the $1.620 resistance or even $1.650 in the near term. The next major hurdle for the bulls might be $1.750 or $1.80.
Are Dips Limited?If XRP fails to clear the $1.450 resistance zone, it could start a downside correction. Initial support on the downside is near the $1.3450 level. The next major support is near the $1.320 level.
If there is a downside break and a close below the $1.320 level, the price might continue to decline toward the $1.300 support. The next major support sits near the $1.240 zone.
Technical Indicators
Hourly MACD – The MACD for XRP/USD is now gaining pace in the bullish zone.
Hourly RSI (Relative Strength Index) – The RSI for XRP/USD is now above the 50 level.
Major Support Levels – $1.4200 and $1.4000.
Major Resistance Levels – $1.4500 and $1.5000.
Original source
Read on NewsBTCRelated market context

Google Gemini AI Predicts Jaw-Dropping XRP Price For Next 90 Days
Google Gemini AI just put XRP back under the spotlight, predicting it is tightly wound for a major breakout toward $1.60 to $1.80...

Elon Musk SpaceX AI Predicts Incredible Bitcoin Price For Next 30 Days
Here is the thing about capitulation calls. They only sound smart in hindsight. Right now, with Bitcoin price scraping along the l...

Uranium Holds Above $85 as Mining ETF Rebounds From June Sell-Off
The latest charts display that the market is divided into stable physical prices and uranium shares trying to regain momentum afte...

Standard Chartered Says Bitcoin Bottomed Near $59,000 As Crypto Winter Ends
TL;DR Standard Chartered’s Geoffrey Kendrick reportedly says Bitcoin’s $59,000 area marked the cycle bottom. The note cites SpaceX...

Tether USDT Briefly Overtakes Ethereum in Market Cap: A $187B Wake-Up Call
For a few hours, earlier this week, Tether USDT stablecoin held a higher market cap than Ethereum, the first time that has happene...

Bitcoin price challenges $64,000 weekend wall – needing a breakout or risk a deeper correction
Bitcoin reclaimed $64,000 on June 12 and touched an intraday high of $64,301 in the same session that spot ETF flows finally flipp...