XRP Price Builds Momentum — $2.50 Break Sparks Fresh Bullish Wave
XRP price started a fresh increase above the $2.50 zone. The price is now showing positive signs and might climb above the $2.62 resistance. XRP price started a fresh increase above the $2.50 zone. The price is now tradi...
Archive context
Older archive item. Useful for background and entity history, but not a fresh market-moving signal.

XRP price started a fresh increase above the $2.50 zone. The price is now showing positive signs and might climb above the $2.62 resistance.
- XRP price started a fresh increase above the $2.50 zone.
- The price is now trading above $2.50 and the 100-hourly Simple Moving Average.
- There is a key bullish trend line forming with support at $2.50 on the hourly chart of the XRP/USD pair (data source from Kraken).
- The pair could start another increase if it stays above the $2.50 zone.
XRP price started a fresh increase after it settled above the $2.40 level, like Bitcoin and Ethereum. The price was able to climb above the $2.450 resistance level.
The recent move was positive and the bulls pushed the price above the $2.50 level. A high was formed at $2.5870 and the price is now consolidating gains above the 23.6% Fib retracement level of the upward move from the $2.250 swing low to the $2.5870 high.
The price is now trading above $2.50 and the 100-hourly Simple Moving Average. Besides, there is a key bullish trend line forming with support at $2.50 on the hourly chart of the XRP/USD pair.
On the upside, the price might face resistance near the $2.5880 level. The first major resistance is near the $2.60 level. A clear move above the $2.60 resistance might send the price toward the $2.620 resistance. Any more gains might send the price toward the $2.650 resistance or even $2.6850 in the near term. The next major hurdle for the bulls might be near the $2.750 zone.
Another Decline?If XRP fails to clear the $2.620 resistance zone, it could start another decline. Initial support on the downside is near the $2.50 level and the trend line zone. The next major support is near the $2.450 level.
If there is a downside break and a close below the $2.450 level, the price might continue to decline toward the $2.420 support or the 50% Fib retracement level of the upward move from the $2.250 swing low to the $2.5870 high. The next major support sits near the $2.40 zone.
Technical Indicators
Hourly MACD – The MACD for XRP/USD is now gaining pace in the bullish zone.
Hourly RSI (Relative Strength Index) – The RSI for XRP/USD is now above the 50 level.
Major Support Levels – $2.50 and $2.450.
Major Resistance Levels – $2.60 and $2.620.
Why this matters
This altcoin story adds another data point to the current market tape and is useful when read alongside nearby source coverage.
Original source
Read on NewsBTCRelated market context

Bitcoin (BTC) Price Prediction: BTC Holds $63K Support—Can Rising Active Addresses Offset Bearish Technical Signals?
Although the BTC price has remained near a key support zone, recent chart signals and Strategy’s sale of a portion of its Bitcoin...

Bitcoin price rebounds to $63K as leverage returns creating short term volatility risk
Bitcoin's rebound has cleared the first test: price recovered. The harder one starts now: proving buyers remain after the squeeze....

Bitcoin needs trillions to go parabolic again as ETF demand fades
Bitcoin’s next major rally may depend less on whether investors still believe in the asset than on whether enough large balance sh...

Bitcoin miner bottom signal now depends on who survives weak mining profits
A Bitcoin miner-stress signal circulating on X has fallen into a zone analysts associate with severe miner pressure, putting a fam...

IRGC fires missiles at commercial ships near Strait of Hormuz, rattling oil and crypto markets
The escalating tensions near the Strait of Hormuz could lead to increased regulatory scrutiny on cryptocurrency transactions and i...
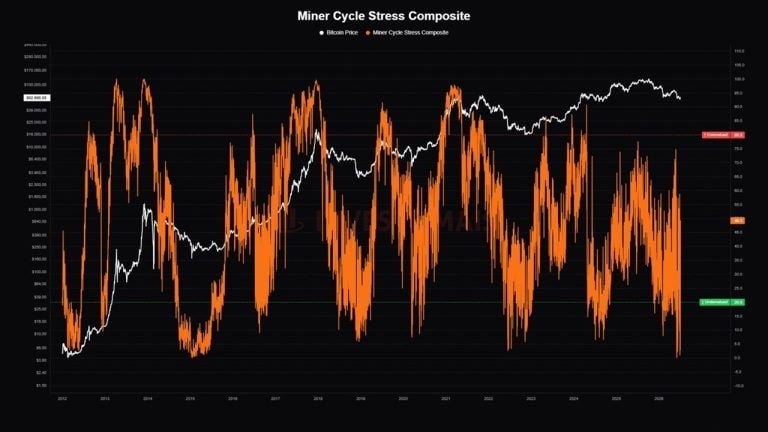
Bitcoin Miner Stress Hits ‘Historically Rare’ Level as 20% of Miners Operate at a Loss
Bitcoin’s Miner Cycle Stress Composite has fallen to a new 2026 low and entered its “undervalued” range, a synchronized decline pr...