XRP Price Climbs Past $2.50 – Bulls Eye Next Barrier After Solid Recovery
XRP price started a fresh increase above $2.250. The price is now showing positive signs but faces a major hurdle near the $2.60 level. XRP price is attempting a recovery wave above the $2.50 zone. The price is now tradi...

XRP price started a fresh increase above $2.250. The price is now showing positive signs but faces a major hurdle near the $2.60 level.
- XRP price is attempting a recovery wave above the $2.50 zone.
- The price is now trading below $2.60 and the 100-hourly Simple Moving Average.
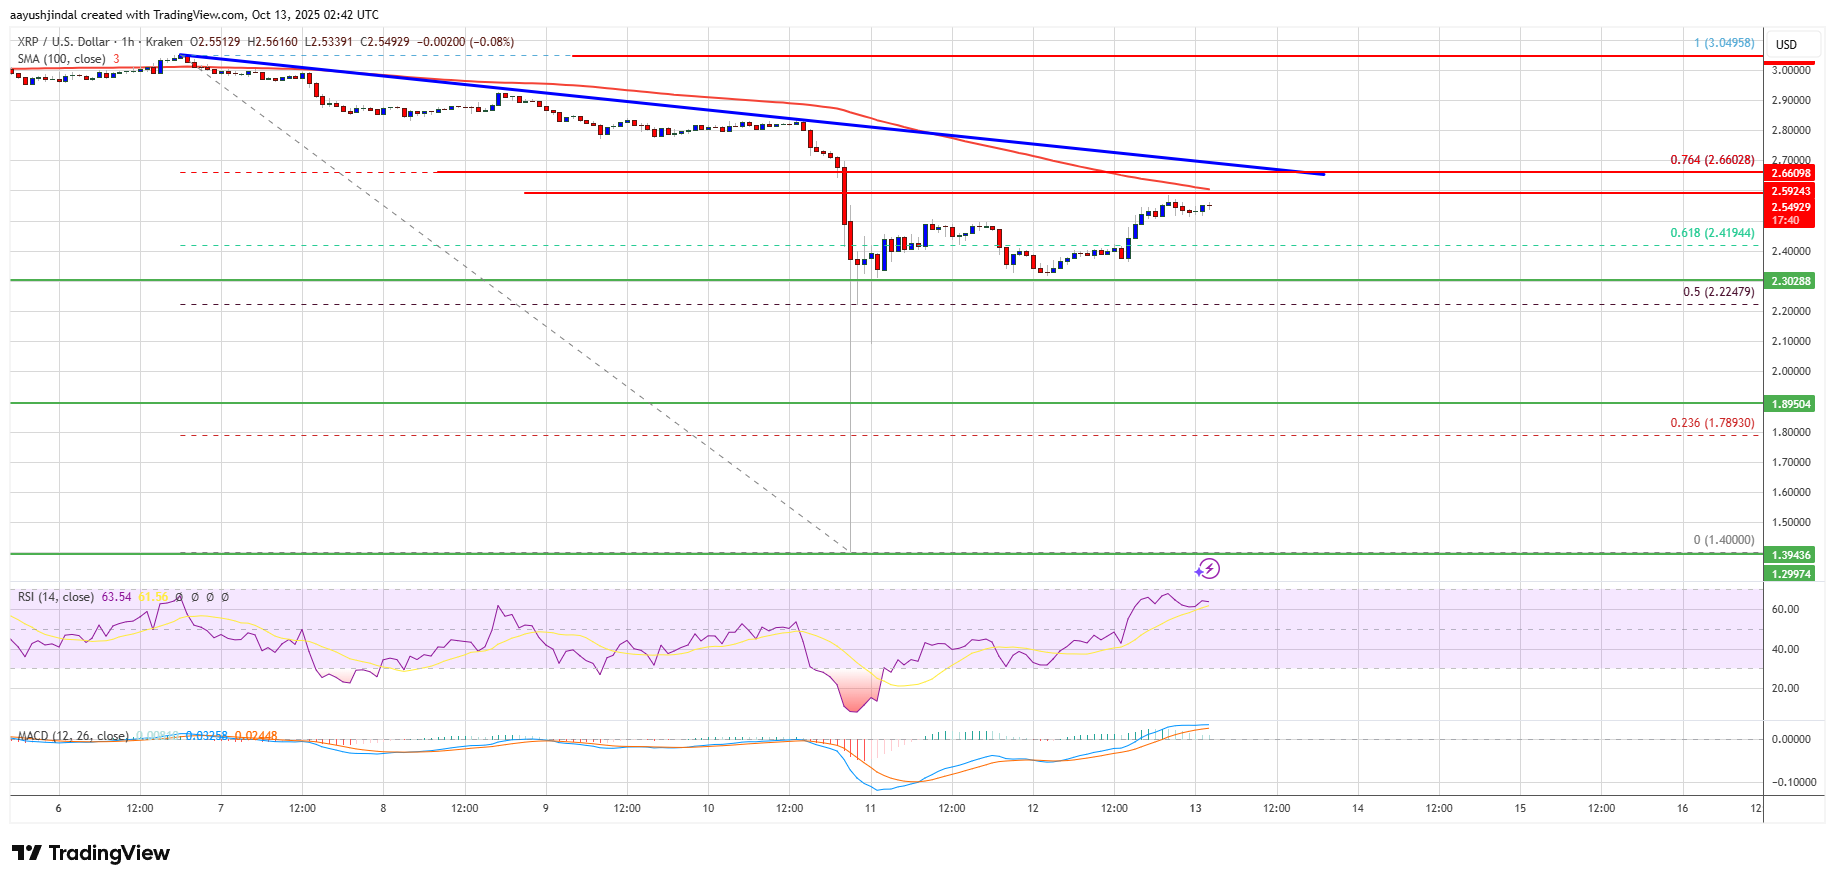
- There is a key bearish trend line forming with resistance at $2.660 on the hourly chart of the XRP/USD pair (data source from Kraken).
- The pair could start a fresh decline if it settles below $2.70.
XRP price found support and started a strong recovery wave above $2.0, like Bitcoin and Ethereum. The price was able to climb above the $2.20 and $2.25 levels to enter a positive zone.
There was a decent increase above the 61.8% Fib retracement level of the downward move from the $3.05 swing high to the $1.40 swing low. However, the price could face hurdles near $2.60. There is also a key bearish trend line forming with resistance at $2.660 on the hourly chart of the XRP/USD pair.
The price is now trading below $2.60 and the 100-hourly Simple Moving Average. If there is a fresh upward move, the price might face resistance near the $2.60 level.
The first major resistance is near the $2.660 level and the trend line. It is close to the 76.4% Fib retracement level of the downward move from the $3.05 swing high to the $1.40 swing low. A clear move above the $2.660 resistance might send the price toward the $2.70 resistance. Any more gains might send the price toward the $2.720 resistance. The next major hurdle for the bulls might be near $2.80.
Another Decline?If XRP fails to clear the $2.60 resistance zone, it could start a fresh decline. Initial support on the downside is near the $2.450 level. The next major support is near the $2.40 level.
If there is a downside break and a close below the $2.40 level, the price might continue to decline toward $2.320. The next major support sits near the $2.30 zone, below which the price could continue lower toward $2.250.
Technical Indicators
Hourly MACD – The MACD for XRP/USD is now gaining pace in the bullish zone.
Hourly RSI (Relative Strength Index) – The RSI for XRP/USD is now above the 50 level.
Major Support Levels – $2.450 and $2.40.
Major Resistance Levels – $2.60 and $2.660.
Original source
Read on NewsBTCRelated market context

The 3-Part Impulse That Shows Where The XRP Price Is Headed Next
XRP bulls are trying to turn a brutal selloff into something bigger than a relief bounce. An interesting setup shows a possible th...

Most Traders Will Scroll Past This Grok AI Bitcoin Predicts, Big Mistake
Elon Musk Grok AI just looked at a Bitcoin chart down more than 50% and predicts it’s a classic accumulation zone, targeting $150,...

XRP Price Prediction: Japan Regulates Crypto like Stocks, XRP to Benefit First
Japan just rewrote the rules. XRP price is battling below resistance at $1.10, but it’s prediction is getting bullish as Japan’s p...

XRP Price Prediction: Japan XRP ETF Listing is Getting Closer
Japan just handed XRP bulls a major regulatory tailwind. XRP price is retesting a congestion zone, and the prediction could turn b...

Ethereum Price Prediction: 3 Million ETH Rushes Into Staking as Sellers Vanish
Is nobody leaving Ethereum? A record 36 million ETH is now locked in staking, roughly 29–30% of the circulating supply, and the va...
Bitcoin Price Prediction: JPMorgan Fuds BTC as Debasement Trade Retreat Accelerates
JPMorgan is calling it. The debasement trade, or the macro thesis that drove billions into Bitcoin price and gold, is unwinding, a...