XRP Price Coils Below Resistance — Bulls Prepare For Possible Upside Explosion
XRP price started a consolidation phase below $2.60. The price is now showing positive signs but faces a major resistance near $2.50 and $2.60. XRP price is attempting a recovery wave above the $2.420 zone. The price is...
Archive context
Older archive item. Useful for background and entity history, but not a fresh market-moving signal.
XRP price started a consolidation phase below $2.60. The price is now showing positive signs but faces a major resistance near $2.50 and $2.60.
- XRP price is attempting a recovery wave above the $2.420 zone.
- The price is now trading below $2.50 and the 100-hourly Simple Moving Average.
- There is a key bearish trend line forming with resistance at $2.50 on the hourly chart of the XRP/USD pair (data source from Kraken).
- The pair could start a fresh surge if it clears the $2.60 resistance.
XRP price found support and started a strong recovery wave above $2.30, like Bitcoin and Ethereum. The price was able to climb above the $2.350 and $2.40 levels to enter a positive zone.
The bulls were able to push the price above the 61.8% Fib retracement level of the downward wave from the $3.05 swing high to the $1.40 swing low. However, the bears are still active near the $2.550 and $2.60 levels. Besides, there is a key bearish trend line forming with resistance at $2.50 on the hourly chart of the XRP/USD pair.
The price is now trading below $2.50 and the 100-hourly Simple Moving Average. If there is a fresh upward move, the price might face resistance near the $2.50 level and the trend line.
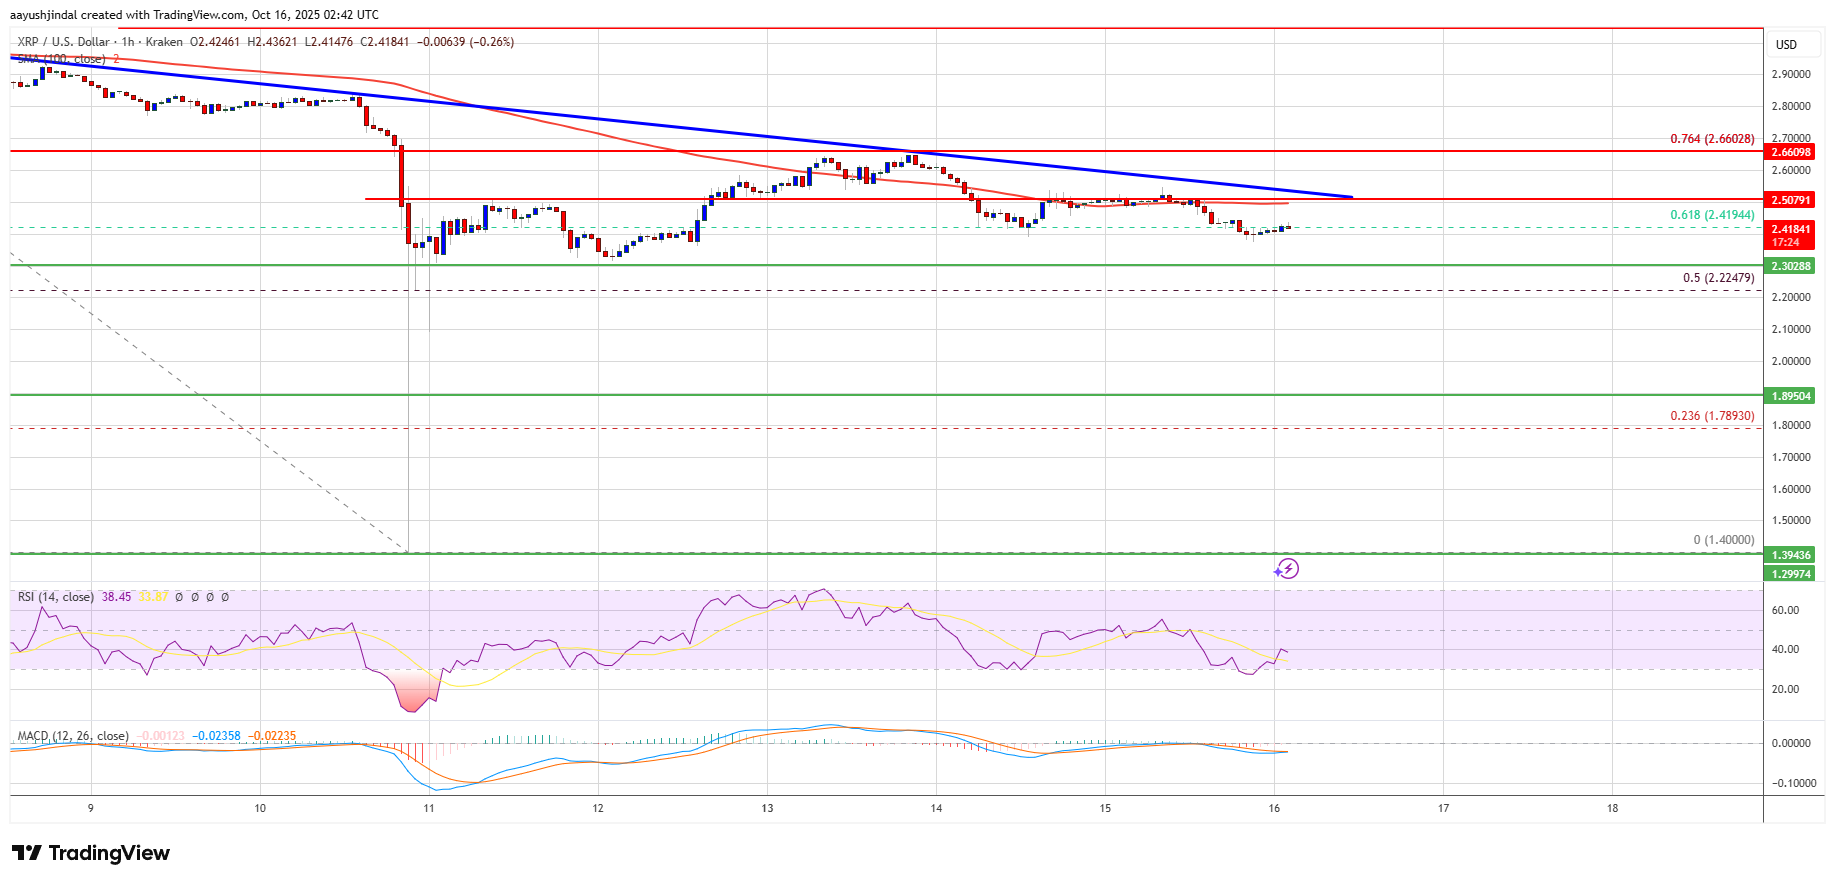
The first major resistance is near the $2.60 level, above which the price could rise and test the 76.4% Fib retracement level of the downward wave from the $3.05 swing high to the $1.40 swing low at $2.660. A clear move above the $2.660 resistance might send the price toward the $2.750 resistance. Any more gains might send the price toward the $2.780 resistance. The next major hurdle for the bulls might be near $2.820.
Another Drop?If XRP fails to clear the $2.50 resistance zone, it could start a fresh decline. Initial support on the downside is near the $2.40 level. The next major support is near the $2.30 level.
If there is a downside break and a close below the $2.30 level, the price might continue to decline toward $2.2420. The next major support sits near the $2.220 zone, below which the price could continue lower toward $2.120.
Technical Indicators
Hourly MACD – The MACD for XRP/USD is now losing pace in the bullish zone.
Hourly RSI (Relative Strength Index) – The RSI for XRP/USD is now below the 50 level.
Major Support Levels – $2.40 and $2.30.
Major Resistance Levels – $2.50 and $2.60.
Why this matters
This altcoin story adds another data point to the current market tape and is useful when read alongside nearby source coverage.
Original source
Read on NewsBTCRelated market context

Ethereum (ETH) Price Prediction: Whale Rotates $155M Into ETH as Longs Surge Near $2,500
Ethereum is trying to stabilize after another volatile stretch, with price returning toward the mid-$2,400 region while several po...

Bitcoin (BTC) Price Prediction: $74K Liquidity Gap Puts $80K Support to the Test
Meanwhile, data from Glassnode and Fasanara Digital show that traditional financial assets are capturing a growing share of deriva...

Lido Puts Liquidity Buffers At The Center Of Ethereum ETP Yield Debate
An Ethereum investment product can advertise staking exposure without putting every unit of its ETH to work. Lido’s October 23 com...

Lido Opens Higher-Balance Ethereum Validators With A Deliberately Small Start
Lido has opened a permissionless route to Ethereum validators that can hold much larger effective balances, but the first allocati...

Bitcoin Slips Below $80,000 as US Evacuations Across the Middle East Spark Risk-Off Weekend
Bitcoin slid to a one-month low near $79,700 as the US evacuated Middle East personnel over Iranian attack threats. Ether, XRP and...
Tether Wins Mining Industry Support For Its Open Automation Toolkit
Tether is trying to make Bitcoin mining equipment easier to operate as one system. Its October 24 announcement brings 15 industry...