XRP Price Consolidates, Gearing Up for Its Next Major Breakout
XRP price extended its decline below the $0.520 support. The price is now trading in a range and eyeing an upside break above the $0.5320 resistance. XRP extended losses and declined below the $0.5120 support. The price...

XRP price extended its decline below the $0.520 support. The price is now trading in a range and eyeing an upside break above the $0.5320 resistance.
- XRP extended losses and declined below the $0.5120 support.
- The price is now trading above $0.5250 and the 100-hourly Simple Moving Average.
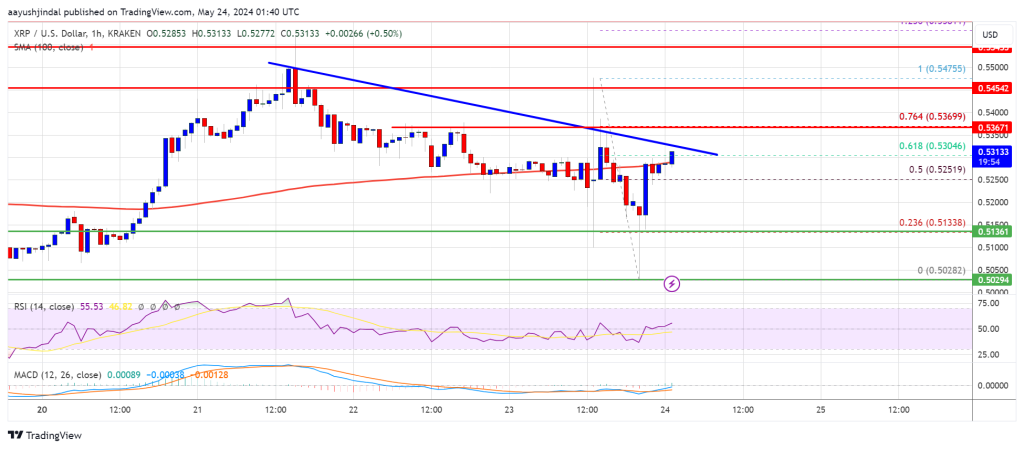
- There is a key bearish trend line forming with resistance at $0.5325 on the hourly chart of the XRP/USD pair (data source from Kraken).
- The pair could gain bullish momentum if it clears the $0.5365 resistance zone.
In the past two sessions, XRP price saw a steady decline below the $0.5320 level. There were a few swing moves like Bitcoin and Ethereum. The price even spiked below the $0.5120 support zone.
A low was formed at $0.5028 and the price is now correcting losses. There was a move above the $0.5200 and $0.5250 resistance levels. The price climbed above the 50% Fib retracement level of the downward move from the $0.5477 swing high to the $0.5028 low.
The price is back above $0.5250 and the 100-hourly Simple Moving Average. Immediate resistance is near the $0.5320 level. There is also a key bearish trend line forming with resistance at $0.5325 on the hourly chart of the XRP/USD pair.
The first key resistance is near $0.5365 or the 76.4% Fib retracement level of the downward move from the $0.5477 swing high to the $0.5028 low. A close above the $0.5365 resistance zone could send the price higher.
The next key resistance is near $0.5480. If the bulls push the price above the $0.5480 resistance level, there could be a steady increase toward the $0.5570 resistance. Any more gains might send the price toward the $0.5800 resistance.
Another Decline?If XRP fails to clear the $0.5320 resistance zone, it could start another decline within the range. Initial support on the downside is near the $0.5250 level and the 100 hourly SMA.
The next major support is at $0.5140. If there is a downside break and a close below the $0.5140 level, the price might gain bearish momentum. In the stated case, the price could decline and retest the $0.5030 support in the near term.
Technical Indicators
Hourly MACD – The MACD for XRP/USD is now gaining pace in the bullish zone.
Hourly RSI (Relative Strength Index) – The RSI for XRP/USD is now above the 50 level.
Major Support Levels – $0.5250 and $0.5140.
Major Resistance Levels – $0.5320 and $0.5365.
Original source
Read on NewsBTCRelated market context

Uranium Holds Above $85 as Mining ETF Rebounds From June Sell-Off
The latest charts display that the market is divided into stable physical prices and uranium shares trying to regain momentum afte...

Google Gemini AI Predicts Jaw-Dropping XRP Price For Next 90 Days
Google Gemini AI just put XRP back under the spotlight, predicting it is tightly wound for a major breakout toward $1.60 to $1.80...

Elon Musk SpaceX AI Predicts Incredible Bitcoin Price For Next 30 Days
Here is the thing about capitulation calls. They only sound smart in hindsight. Right now, with Bitcoin price scraping along the l...

Standard Chartered Says Bitcoin Bottomed Near $59,000 As Crypto Winter Ends
TL;DR Standard Chartered’s Geoffrey Kendrick reportedly says Bitcoin’s $59,000 area marked the cycle bottom. The note cites SpaceX...

Bitcoin price challenges $64,000 weekend wall – needing a breakout or risk a deeper correction
Bitcoin reclaimed $64,000 on June 12 and touched an intraday high of $64,301 in the same session that spot ETF flows finally flipp...

Elon Musk’s trillionaire status puts his net worth above crypto’s entire market cap outside Bitcoin
Elon Musk has become the first person in modern history to amass a personal net worth exceeding $1 trillion, crossing the historic...