XRP Price Danger Zone: Key Support Levels to Watch
XRP price failed to stay above the $0.4840 support zone. The price declined and tested the $0.4750 support zone, and is now at risk of more losses. XRP extended losses and traded below the $0.4840 support zone. The price...

XRP price failed to stay above the $0.4840 support zone. The price declined and tested the $0.4750 support zone, and is now at risk of more losses.
- XRP extended losses and traded below the $0.4840 support zone.
- The price is now trading below $0.4880 and the 100-hourly Simple Moving Average.
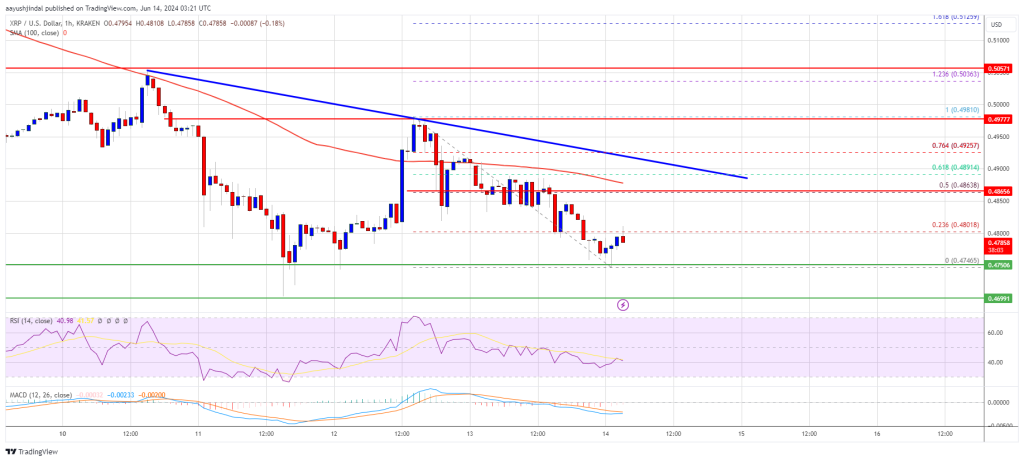
- There is a connecting bearish trend line forming with resistance at $0.4880 on the hourly chart of the XRP/USD pair (data source from Kraken).
- The pair could recover, but the upside might be limited above the $0.4920 resistance.
XRP price failed to recover above the $0.4950 resistance like Ethereum and Bitcoin. The price started a fresh decline from the $0.4981 high. There was a move below the $0.4880 and $0.4850 levels.
The price declined below the $0.480 level. A low was formed at $0.4746 and the price is now consolidating losses. It is testing the 23.6% Fib retracement level of the recent decline from the $0.4981 swing high to the $0.4746 low. The price is now trading below $0.4920 and the 100-hourly Simple Moving Average.
If the bulls protect the $0.4740 support, there might be an upside correction. On the upside, the price is facing resistance near the $0.4820 level. The first key resistance is near $0.4850 or the 50% Fib retracement level of the recent decline from the $0.4981 swing high to the $0.4746 low.
There is also a connecting bearish trend line forming with resistance at $0.4880 on the hourly chart of the XRP/USD pair. The next major resistance is near the $0.4950 level.
A close above the $0.4950 resistance zone could send the price higher. The next key resistance is near $0.5050. If there is a close above the $0.5050 resistance level, there could be a steady increase toward the $0.5250 resistance. Any more gains might send the price toward the $0.5320 resistance.
More Downsides?If XRP fails to clear the $0.4850 resistance zone, it could continue to move down. Initial support on the downside is near the $0.4740 level.
The next major support is at $0.470. If there is a downside break and a close below the $0.470 level, the price might gain bearish momentum. In the stated case, the price could decline and retest the $0.450 support in the near term.
Technical Indicators
Hourly MACD – The MACD for XRP/USD is now gaining pace in the bearish zone.
Hourly RSI (Relative Strength Index) – The RSI for XRP/USD is now below the 50 level.
Major Support Levels – $0.4740 and $0.4700.
Major Resistance Levels – $0.4850 and $0.4920.
Original source
Read on NewsBTCRelated market context

Uranium Holds Above $85 as Mining ETF Rebounds From June Sell-Off
The latest charts display that the market is divided into stable physical prices and uranium shares trying to regain momentum afte...

Standard Chartered Says Bitcoin Bottomed Near $59,000 As Crypto Winter Ends
TL;DR Standard Chartered’s Geoffrey Kendrick reportedly says Bitcoin’s $59,000 area marked the cycle bottom. The note cites SpaceX...

XRP aims for $0.90 as ETF demand battles selling pressure from whales
XRP is trading at $1.11, down roughly 17% from its June opening, having set a new 2026 low on June 5 and shed $8 billion in market...

Bitcoin rises above $64,000 after Pakistan prime minister says Iran peace deal is near
Bitcoin traded above $64,000 on Saturday, supported by its strongest ETF inflows in a month and growing optimism around geopolitic...

US forces shoot down Iranian attack drones near Strait of Hormuz, Bitcoin drops below $73K
Geopolitical tensions near vital oil routes can destabilize financial markets, highlighting the interconnectedness of global secur...

XRP Price Prediction: Japan XRP ETF Listing is Getting Closer
Japan just handed XRP bulls a major regulatory tailwind. XRP price is retesting a congestion zone, and the prediction could turn b...