XRP Price Dips Under Crucial Support, Putting Spotlight on Lower Price Targets
XRP price started a fresh decline below $2.150. The price is now struggling and faces resistance near the $2.10 pivot level. XRP price started a fresh decline below the $2.150 zone. The price is now trading below $2.120...
Archive context
Older archive item. Useful for background and entity history, but not a fresh market-moving signal.

XRP price started a fresh decline below $2.150. The price is now struggling and faces resistance near the $2.10 pivot level.
- XRP price started a fresh decline below the $2.150 zone.
- The price is now trading below $2.120 and the 100-hourly Simple Moving Average.
- There was a break below a key bullish trend line with support at $2.180 on the hourly chart of the XRP/USD pair (data source from Kraken).
- The pair could continue to move down if it settles below $2.00.
XRP price attempted a recovery wave above $2.150 but failed to continue higher, like Bitcoin and Ethereum. The price started a fresh decline below $2.120 and $2.10.
There was a move below the 50% Fib retracement level of the upward move from the $1.817 swing low to the $2.286 high. Besides, there was a break below a key bullish trend line with support at $2.180 on the hourly chart of the XRP/USD pair.
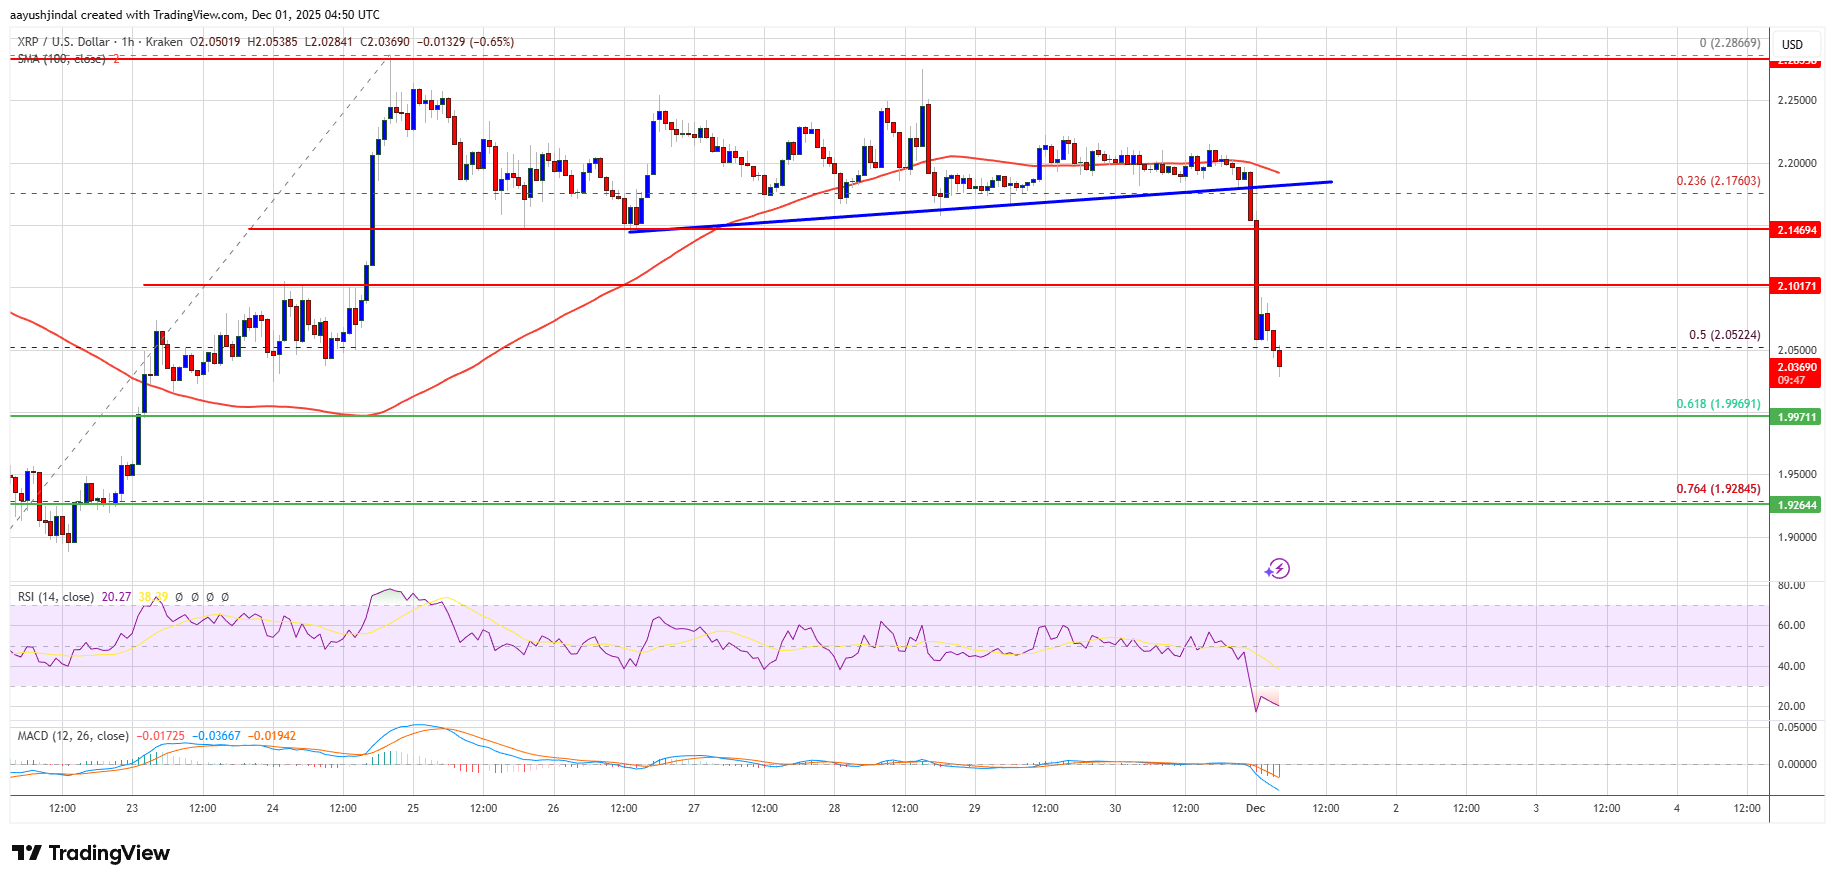
The price is now trading below $2.10 and the 100-hourly Simple Moving Average. If there is a fresh upward move, the price might face resistance near the $2.080 level. The first major resistance is near the $2.10 level. A close above $2.10 could send the price to $2.120. The next hurdle sits at $2.150. A clear move above the $2.150 resistance might send the price toward the $2.20 resistance. Any more gains might send the price toward the $2.250 resistance. The next major hurdle for the bulls might be near $2.320.
More Losses?If XRP fails to clear the $2.10 resistance zone, it could start a fresh decline. Initial support on the downside is near the $2.00 level or the 61.8% Fib retracement level of the upward move from the $1.817 swing low to the $2.286 high. The next major support is near the $1.9250 level.
If there is a downside break and a close below the $1.9250 level, the price might continue to decline toward $1.850. The next major support sits near the $1.820 zone, below which the price could continue lower toward $1.80.
Technical Indicators
Hourly MACD – The MACD for XRP/USD is now gaining pace in the bearish zone.
Hourly RSI (Relative Strength Index) – The RSI for XRP/USD is now below the 50 level.
Major Support Levels – $2.00 and $1.9250.
Major Resistance Levels – $2.10 and $2.120.
Why this matters
This altcoin story adds another data point to the current market tape and is useful when read alongside nearby source coverage.
Original source
Read on NewsBTCRelated market context

Ethereum (ETH) Price Prediction: Whale Rotates $155M Into ETH as Longs Surge Near $2,500
Ethereum is trying to stabilize after another volatile stretch, with price returning toward the mid-$2,400 region while several po...

Bitcoin (BTC) Price Prediction: $74K Liquidity Gap Puts $80K Support to the Test
Meanwhile, data from Glassnode and Fasanara Digital show that traditional financial assets are capturing a growing share of deriva...

Bitcoin Steadies Near $81,700 as Pepe-Led Memecoin Rally Outpaces Majors
Bitcoin recovered to around $81,700 as Pepe jumped 13% and memecoins added 2.9%, with traders eyeing the Fed meeting of 27-28 Octo...
Bitcoin ETF Week Stays Positive After Nearly $774 Million In Late Outflows
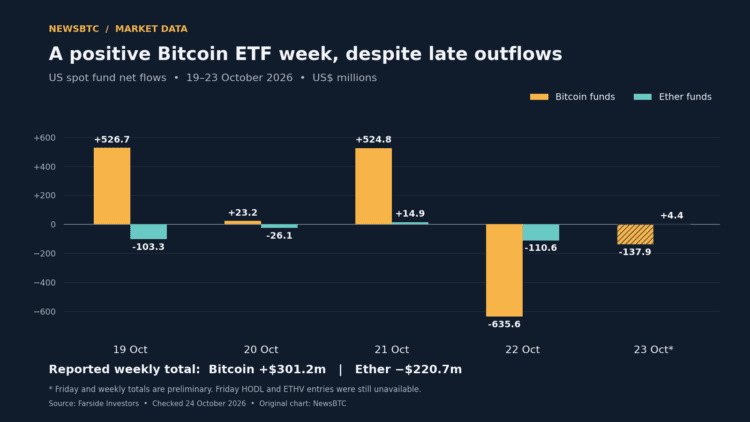
TL;DR: Farside’s preliminary figures show US Bitcoin funds retaining a $301.2 million weekly inflow despite two days of withdrawal...
Bitcoin ETF Flows Trail Price Moves, DWF Study Finds
Bitcoin ETF flows track recent price moves more closely than subsequent ones, according to DWF Labs research published October 22....

Austin Griffith Demonstrates How Fast Bots Can Drain Weak Ethereum Keys
Austin Griffith of the Ethereum Foundation put about $1 in an Ethereum wallet whose private key was the number 6969, and bots went...