XRP Price Eyes $0.60: Can It Pick Up the Pace?
XRP price started a recovery wave from the $0.5440 zone. The price is now eyeing more gains above the $0.5720 resistance zone in the near term. XRP price started a decent increase from the $0.5400 zone. The price is now...

XRP price started a recovery wave from the $0.5440 zone. The price is now eyeing more gains above the $0.5720 resistance zone in the near term.
- XRP price started a decent increase from the $0.5400 zone.
- The price is now trading above $0.5620 and the 100-hourly Simple Moving Average.
- There was a break above a connecting bearish trend line with resistance at $0.5560 on the hourly chart of the XRP/USD pair (data source from Kraken).
- The pair could climb higher toward the $0.600 zone if it clears the $0.5720 resistance zone.
XRP price extended losses like Bitcoin and Ethereum. The price even tested the $0.5440 zone before the bulls appeared. The price started a recovery wave and was able to climb above the $0.5550 resistance zone.
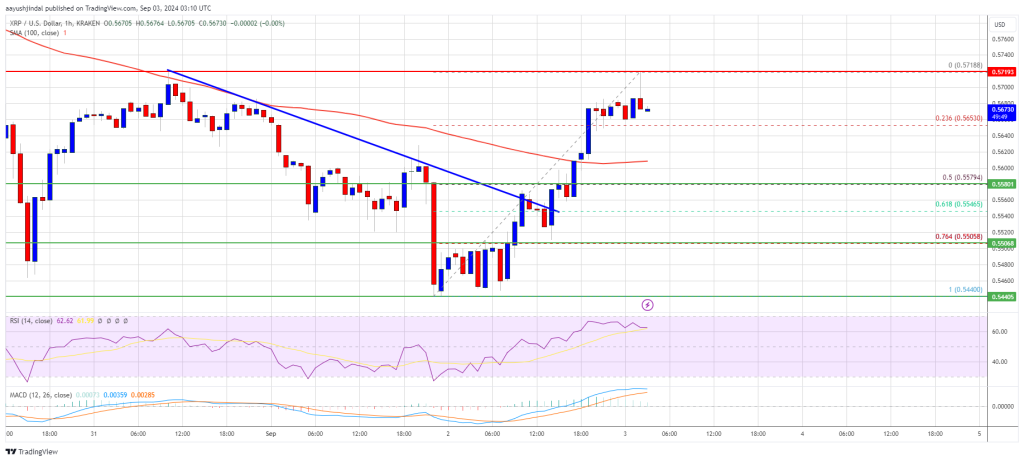
Besides, there was a break above a connecting bearish trend line with resistance at $0.5560 on the hourly chart of the XRP/USD pair. There was a clear move above the $0.5650 resistance. Finally, it retested the $0.5720 resistance zone.
A high was formed at $0.5718 and the price is now consolidating gains. It is trading above the 23.6% Fib retracement level of the upward move from the $0.5440 swing low to the $0.5718 high.
The price is now trading above $0.5620 and the 100-hourly Simple Moving Average. On the upside, the price might face resistance near the $0.570 level. The first major resistance is near the $0.5720 level. The next key resistance could be $0.5850. A clear move above the $0.5850 resistance might send the price toward the $0.600 resistance.
The next major resistance is near the $0.6060 level. Any more gains might send the price toward the $0.6150 resistance or even $0.620 in the near term.
Another Decline?If XRP fails to clear the $0.5720 resistance zone, it could start another decline. Initial support on the downside is near the $0.562 level. The next major support is at $0.5580 or the 50% Fib retracement level of the upward move from the $0.5440 swing low to the $0.5718 high.
If there is a downside break and a close below the $0.5580 level, the price might continue to decline toward the $0.5440 support in the near term. The next major support sits at $0.5320.
Technical Indicators
Hourly MACD – The MACD for XRP/USD is now losing pace in the bullish zone.
Hourly RSI (Relative Strength Index) – The RSI for XRP/USD is now above the 50 level.
Major Support Levels – $0.5580 and $0.5440.
Major Resistance Levels – $0.5720 and $0.5850.
Original source
Read on NewsBTCRelated market context

Uranium Holds Above $85 as Mining ETF Rebounds From June Sell-Off
The latest charts display that the market is divided into stable physical prices and uranium shares trying to regain momentum afte...

Standard Chartered Says Bitcoin Bottomed Near $59,000 As Crypto Winter Ends
TL;DR Standard Chartered’s Geoffrey Kendrick reportedly says Bitcoin’s $59,000 area marked the cycle bottom. The note cites SpaceX...

Google Gemini AI Predicts Jaw-Dropping XRP Price For Next 90 Days
Google Gemini AI just put XRP back under the spotlight, predicting it is tightly wound for a major breakout toward $1.60 to $1.80...

Bitcoin price challenges $64,000 weekend wall – needing a breakout or risk a deeper correction
Bitcoin reclaimed $64,000 on June 12 and touched an intraday high of $64,301 in the same session that spot ETF flows finally flipp...

Elon Musk SpaceX AI Predicts Incredible Bitcoin Price For Next 30 Days
Here is the thing about capitulation calls. They only sound smart in hindsight. Right now, with Bitcoin price scraping along the l...

Tether USDT Briefly Overtakes Ethereum in Market Cap: A $187B Wake-Up Call
For a few hours, earlier this week, Tether USDT stablecoin held a higher market cap than Ethereum, the first time that has happene...