XRP Price Eyes Upside Break: Will The Gains Keep Rolling?
XRP price started a fresh increase from the $0.540 zone. The price is now rising and eyeing an upside break above the $0.600 resistance zone. XRP price started a fresh increase above the $0.580 zone. The price is now tra...

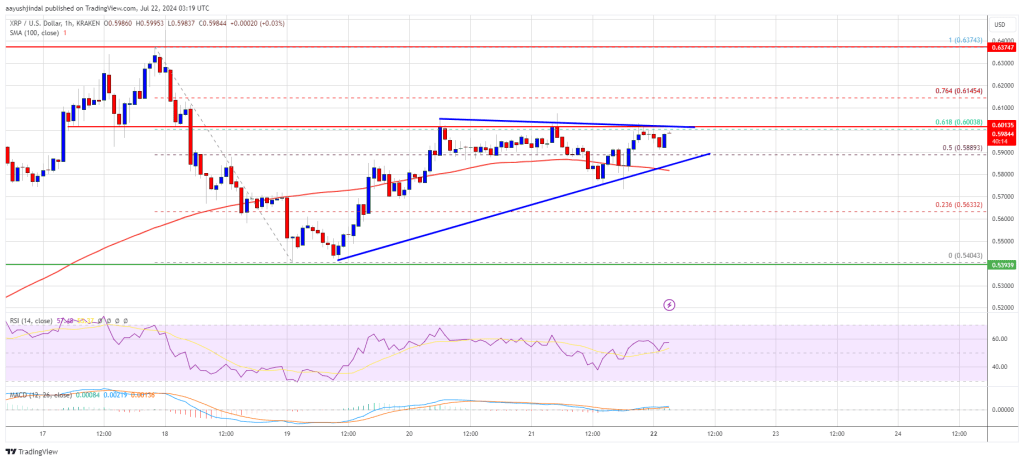
XRP price started a fresh increase from the $0.540 zone. The price is now rising and eyeing an upside break above the $0.600 resistance zone.
- XRP price started a fresh increase above the $0.580 zone.
- The price is now trading above $0.580 and the 100-hourly Simple Moving Average.
- There is a key contracting triangle forming with support at $0.5880 on the hourly chart of the XRP/USD pair (data source from Kraken).
- The pair could extend gain bullish momentum if it clears the $0.60 resistance zone.
XRP price remained stable above the $0.540 level and started a fresh increase. There was a move above the $0.5650 and $0.5720 resistance levels but lagged Ethereum and Bitcoin.
The price climbed above the 50% Fib retracement level of the downward move from the $0.6374 swing high to the $0.5404 low. The current price action is positive above the 100-hourly Simple Moving Average, but the bulls are now facing resistance near the $0.600 level.
There is also a key contracting triangle forming with support at $0.5880 on the hourly chart of the XRP/USD pair. The pair is now trading above $0.5880 and the 100-hourly Simple Moving Average.
If there is a fresh upward move, the price could face resistance near the $0.600 level. The first major resistance is near the $0.6150 level. The next key resistance could be $0.6370. A clear move above the $0.6370 resistance might send the price toward the $0.650 resistance. The next major resistance is near the $0.6665 level. Any more gains might send the price toward the $0.680 resistance.
Another Drop?If XRP fails to clear the $0.600 resistance zone, it could start another decline. Initial support on the downside is near the $0.5880 level and the triangle lower trend line. The next major support is at $0.5650.
If there is a downside break and a close below the $0.5650 level, the price might continue to decline toward the $0.540 support in the near term.
Technical Indicators
Hourly MACD – The MACD for XRP/USD is now gaining pace in the bullish zone.
Hourly RSI (Relative Strength Index) – The RSI for XRP/USD is now above the 50 level.
Major Support Levels – $0.5880 and $0.5650.
Major Resistance Levels – $0.6000 and $0.6150.
Original source
Read on NewsBTCRelated market context

Uranium Holds Above $85 as Mining ETF Rebounds From June Sell-Off
The latest charts display that the market is divided into stable physical prices and uranium shares trying to regain momentum afte...

Bitcoin price challenges $64,000 weekend wall – needing a breakout or risk a deeper correction
Bitcoin reclaimed $64,000 on June 12 and touched an intraday high of $64,301 in the same session that spot ETF flows finally flipp...

Standard Chartered Says Bitcoin Bottomed Near $59,000 As Crypto Winter Ends
TL;DR Standard Chartered’s Geoffrey Kendrick reportedly says Bitcoin’s $59,000 area marked the cycle bottom. The note cites SpaceX...

Google Gemini AI Predicts Jaw-Dropping XRP Price For Next 90 Days
Google Gemini AI just put XRP back under the spotlight, predicting it is tightly wound for a major breakout toward $1.60 to $1.80...

Elon Musk SpaceX AI Predicts Incredible Bitcoin Price For Next 30 Days
Here is the thing about capitulation calls. They only sound smart in hindsight. Right now, with Bitcoin price scraping along the l...

Bitcoin rises above $64,000 after Pakistan prime minister says Iran peace deal is near
Bitcoin traded above $64,000 on Saturday, supported by its strongest ETF inflows in a month and growing optimism around geopolitic...