XRP Price Falls Below $0.50: Key Takeaways for the Market
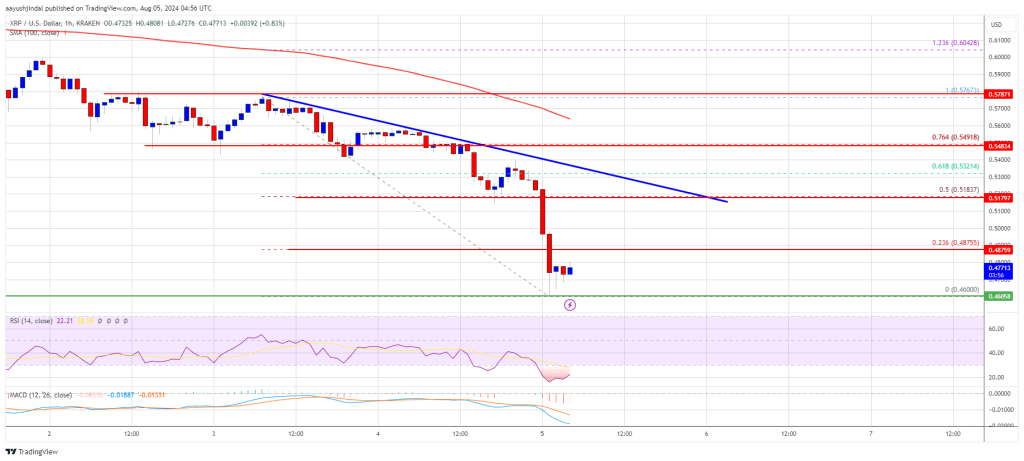
XRP price is down over 15% and trading below $0.50. The price is showing bearish signs and might struggle to recover above the $0.520 resistance. XRP price traded below the $0.500 and $0.4850 support levels. The price is...

XRP price is down over 15% and trading below $0.50. The price is showing bearish signs and might struggle to recover above the $0.520 resistance.
- XRP price traded below the $0.500 and $0.4850 support levels.
- The price is now trading below $0.4880 and the 100-hourly Simple Moving Average.
- There is a key bearish trend line forming with resistance at $0.5180 on the hourly chart of the XRP/USD pair (data source from Kraken).
- The pair could attempt a steady recovery wave if it clears the $0.520 resistance zone.
XRP price started a major decline below the $0.500 support after Ethereum and Bitcoin nosedived. There was a major decline below the $0.4850 support zone.
The price tested the $0.460 zone. A low is formed at $0.460 and the price is now consolidating losses. It is showing a lot of bearish signs below the 23.6% Fib retracement level of the downward move from the $0.5767 swing high to the $0.460 low.
The price is now trading below $0.5880 and the 100-hourly Simple Moving Average. There is also a key bearish trend line forming with resistance at $0.5180 on the hourly chart of the XRP/USD pair. If there is a recovery wave, the price could face resistance near the $0.4880 level.
The first major resistance is near the $0.500 level. The next key resistance could be $0.5180 or the trend line or the 50% Fib retracement level of the downward move from the $0.5767 swing high to the $0.460 low. A clear move above the $0.520 resistance might send the price toward the $0.5350 resistance.
The next major resistance is near the $0.5440 level. Any more gains might send the price toward the $0.550 resistance or even $0.5650 in the near term.
More Downsides?If XRP fails to clear the $0.520 resistance zone, it could continue to move down. Initial support on the downside is near the $0.4650 level. The next major support is at $0.460.
If there is a downside break and a close below the $0.460 level, the price might continue to decline toward the $0.4350 support in the near term. The next major support sits at $0.4250.
Technical Indicators
Hourly MACD – The MACD for XRP/USD is now gaining pace in the bearish zone.
Hourly RSI (Relative Strength Index) – The RSI for XRP/USD is now below the 50 level.
Major Support Levels – $0.4600 and $0.4500.
Major Resistance Levels – $0.5000 and $0.5200.
Original source
Read on NewsBTCRelated market context

Standard Chartered Says Bitcoin Bottomed Near $59,000 As Crypto Winter Ends
TL;DR Standard Chartered’s Geoffrey Kendrick reportedly says Bitcoin’s $59,000 area marked the cycle bottom. The note cites SpaceX...

Google Gemini AI Predicts Jaw-Dropping XRP Price For Next 90 Days
Google Gemini AI just put XRP back under the spotlight, predicting it is tightly wound for a major breakout toward $1.60 to $1.80...

Bitcoin price challenges $64,000 weekend wall – needing a breakout or risk a deeper correction
Bitcoin reclaimed $64,000 on June 12 and touched an intraday high of $64,301 in the same session that spot ETF flows finally flipp...

US forces shoot down Iranian attack drones near Strait of Hormuz, Bitcoin drops below $73K
Geopolitical tensions near vital oil routes can destabilize financial markets, highlighting the interconnectedness of global secur...

Uranium Holds Above $85 as Mining ETF Rebounds From June Sell-Off
The latest charts display that the market is divided into stable physical prices and uranium shares trying to regain momentum afte...

Tether USDT Briefly Overtakes Ethereum in Market Cap: A $187B Wake-Up Call
For a few hours, earlier this week, Tether USDT stablecoin held a higher market cap than Ethereum, the first time that has happene...