XRP Price Fights Resistance—Breakout or Breakdown on Deck?
XRP price started a fresh decline below $2.080. The price is now struggling and faces resistance near the $2.040 resistance level. XRP price started a fresh decline below the $2.050 zone. The price is now trading below $...

XRP price started a fresh decline below $2.080. The price is now struggling and faces resistance near the $2.040 resistance level.
- XRP price started a fresh decline below the $2.050 zone.
- The price is now trading below $2.050 and the 100-hourly Simple Moving Average.
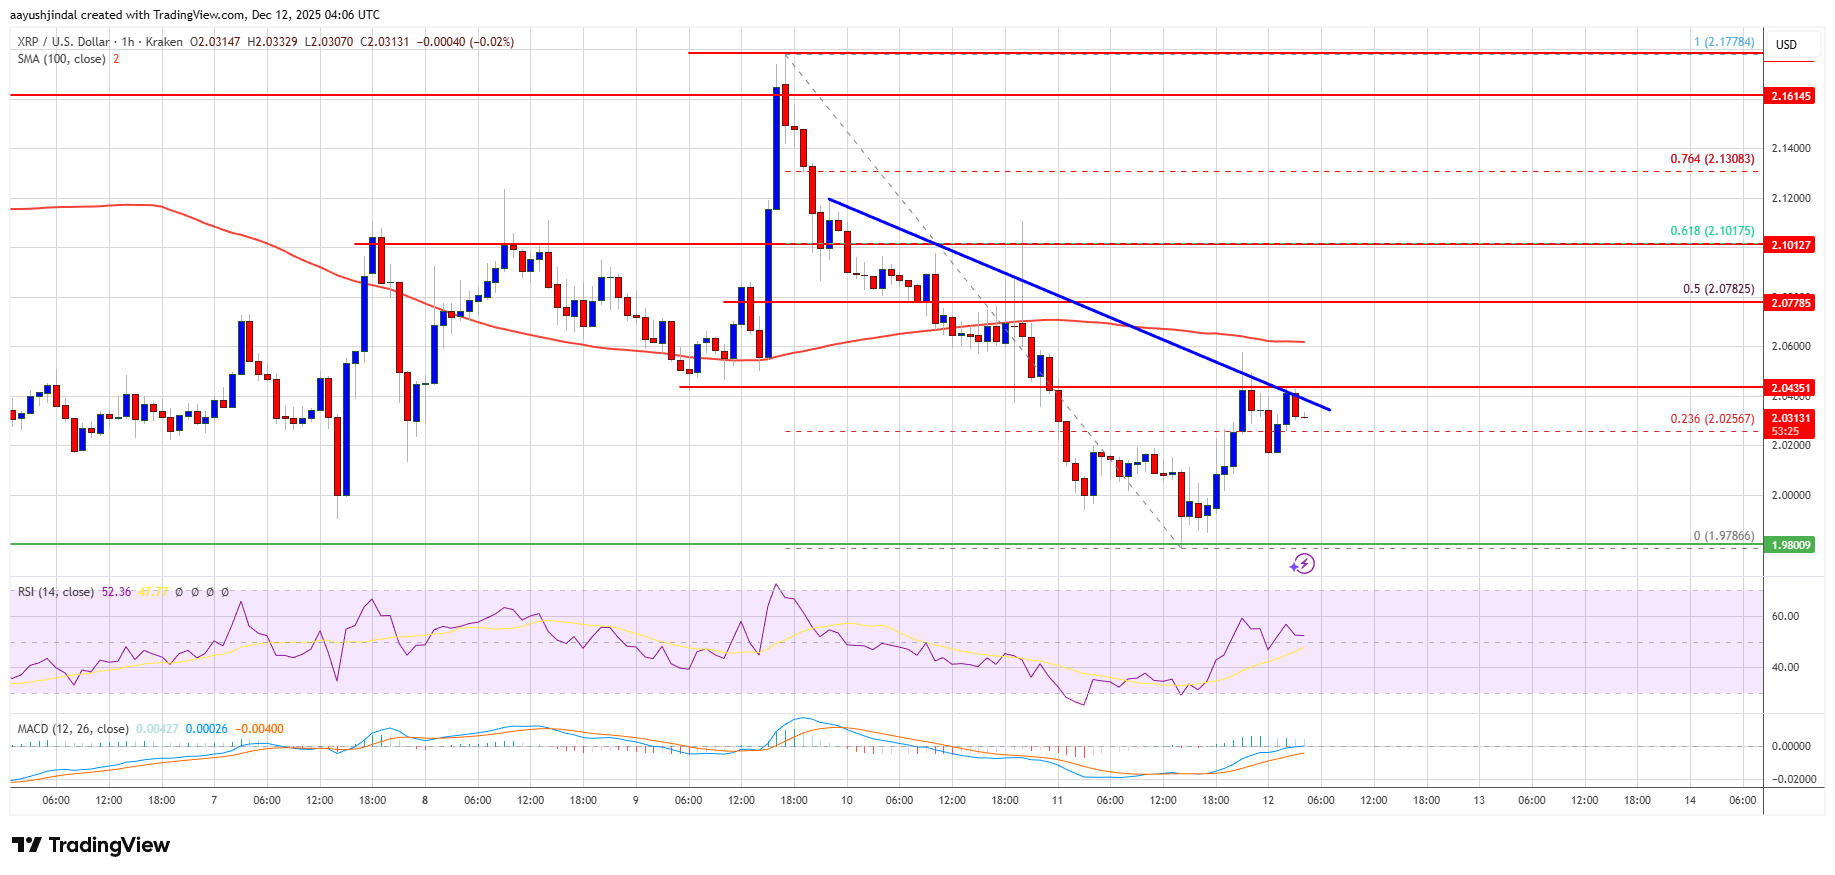
- There is a bearish trend line forming with resistance at $2.040 on the hourly chart of the XRP/USD pair (data source from Kraken).
- The pair could continue to move down if it settles below $2.00.
XRP price attempted a recovery wave above $2.150 but failed to continue higher, like Bitcoin and Ethereum. The price started a fresh decline below $2.080 and $2.050.
There was a move below the $2.00 support level. A low was formed at $1.993, and the price recently started an upside correction. There was a move above the 23.6% Fib retracement level of the downward move from the $2.177 swing high to the $1.993 low.
However, the bears are active near $2.040 and $2.050. There is also a bearish trend line forming with resistance at $2.040 on the hourly chart of the XRP/USD pair. The price is now trading below $2.050 and the 100-hourly Simple Moving Average.
If there is a fresh upward move, the price might face resistance near the $2.040 level. The first major resistance is near the $2.080 level or the 50% Fib retracement level of the downward move from the $2.177 swing high to the $1.993 low.
A close above $2.080 could send the price to $2.012. The next hurdle sits at $2.150. A clear move above the $2.150 resistance might send the price toward the $2.1850 resistance. Any more gains might send the price toward the $2.220 resistance. The next major hurdle for the bulls might be near $2.250.
Another Decline?If XRP fails to clear the $2.040 resistance zone, it could start a fresh decline. Initial support on the downside is near the $2.00 level. The next major support is near the $1.9880 level.
If there is a downside break and a close below the $1.9880 level, the price might continue to decline toward $1.920. The next major support sits near the $1.880 zone, below which the price could continue lower toward $1.820.
Technical Indicators
Hourly MACD – The MACD for XRP/USD is now losing pace in the bearish zone.
Hourly RSI (Relative Strength Index) – The RSI for XRP/USD is now above the 50 level.
Major Support Levels – $2.00 and $1.9850.
Major Resistance Levels – $2.040 and $2.080.
Original source
Read on NewsBTCRelated market context

Bitcoin (BTC) Price Prediction: BTC Eyes $70K Liquidity Sweep as Whales Reclaim Control Near $62K
Market data suggests that long-term holders remain largely inactive, while whale activity is beginning to recover, creating an int...

Ethereum Nears 200 Million Non-Empty Wallets Despite Market Uncertainty
Despite persistent market uncertainty and bearish sentiment across parts of the cryptocurrency sector, Ethereum is approaching a s...

Ethereum Futures Just Hit A Binance Record: Are Traders Calling The Bottom?
Ethereum derivatives activity is flashing a fresh signal on Binance, where open interest measured in ETH terms has reached a new a...

Ethereum Price Prediction: 3 Million ETH Rushes Into Staking as Sellers Vanish
Is nobody leaving Ethereum? A record 36 million ETH is now locked in staking, roughly 29–30% of the circulating supply, and the va...

The 3-Part Impulse That Shows Where The XRP Price Is Headed Next
XRP bulls are trying to turn a brutal selloff into something bigger than a relief bounce. An interesting setup shows a possible th...

XRP Price Prediction: Japan Regulates Crypto like Stocks, XRP to Benefit First
Japan just rewrote the rules. XRP price is battling below resistance at $1.10, but it’s prediction is getting bullish as Japan’s p...