XRP Price Holds Ground at $0.50: Can Bulls Push for a Comeback?
XRP price managed to stay above the $0.5000 level. The price is rebounding and must clear the $0.5480 resistance level to start a decent increase. XRP price is struggling to gain pace for a move above the $0.5350 zone. T...

XRP price managed to stay above the $0.5000 level. The price is rebounding and must clear the $0.5480 resistance level to start a decent increase.
- XRP price is struggling to gain pace for a move above the $0.5350 zone.
- The price is now trading below $0.5320 and the 100-hourly Simple Moving Average.
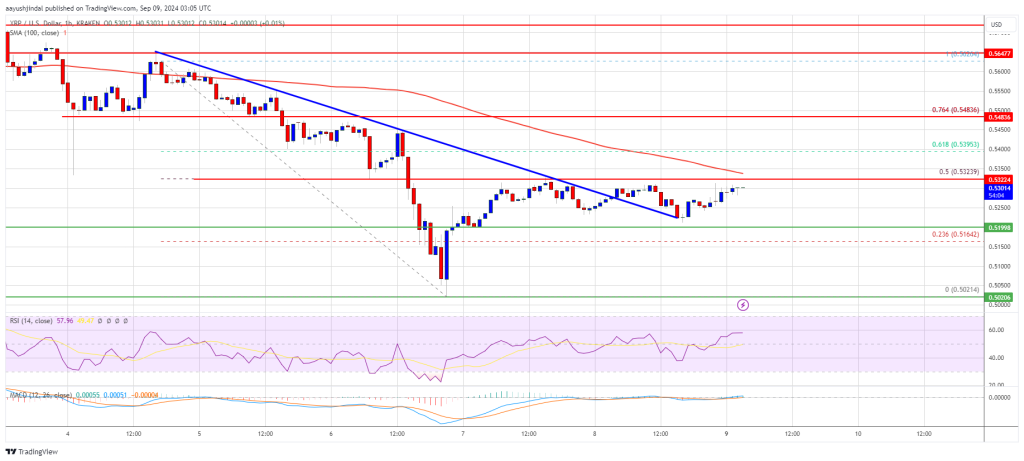
- There was a break above a key bearish trend line with resistance at $0.5280 on the hourly chart of the XRP/USD pair (data source from Kraken).
- The pair could decline again if it fails to clear $0.5320 and $0.5480.
XRP price extended losses below $0.5350 like Bitcoin and Ethereum. There was a fresh decline, and the price retested the $0.5020 support zone. A low was formed at $0.5021 and the price is now attempting a recovery wave.
There was a minor increase above the $0.520 level. The price surpassed the 23.6% Fib retracement level of the downward move from the $0.5626 swing high to the $0.5021 low. There was a break above a key bearish trend line with resistance at $0.5280 on the hourly chart of the XRP/USD pair.
However, the bears seem to be active near the $0.5320 and $0.5350 levels. The price is now trading below $0.5350 and the 100-hourly Simple Moving Average. On the upside, the price might face resistance near the $0.5320 level.
The first major resistance is near the $0.5480 level or the 76.4% Fib retracement level of the downward move from the $0.5626 swing high to the $0.5021 low. The next key resistance could be $0.5550. A clear move above the $0.5550 resistance might send the price toward the $0.5620 resistance.
The next major resistance is near the $0.5750 level. Any more gains might send the price toward the $0.5880 resistance or even $0.600 in the near term.
Another Decline?If XRP fails to clear the $0.5320 resistance zone, it could start another decline. Initial support on the downside is near the $0.5220 level. The next major support is $0.5200.
If there is a downside break and a close below the $0.5200 level, the price might continue to decline toward the $0.5120 support in the near term. The next major support sits at $0.5020.
Technical Indicators
Hourly MACD – The MACD for XRP/USD is now losing pace in the bearish zone.
Hourly RSI (Relative Strength Index) – The RSI for XRP/USD is now above the 50 level.
Major Support Levels – $0.5200 and $0.5120.
Major Resistance Levels – $0.5320 and $0.5480.
Original source
Read on NewsBTCRelated market context

Uranium Holds Above $85 as Mining ETF Rebounds From June Sell-Off
The latest charts display that the market is divided into stable physical prices and uranium shares trying to regain momentum afte...

Standard Chartered Says Bitcoin Bottomed Near $59,000 As Crypto Winter Ends
TL;DR Standard Chartered’s Geoffrey Kendrick reportedly says Bitcoin’s $59,000 area marked the cycle bottom. The note cites SpaceX...

Google Gemini AI Predicts Jaw-Dropping XRP Price For Next 90 Days
Google Gemini AI just put XRP back under the spotlight, predicting it is tightly wound for a major breakout toward $1.60 to $1.80...

Bitcoin price challenges $64,000 weekend wall – needing a breakout or risk a deeper correction
Bitcoin reclaimed $64,000 on June 12 and touched an intraday high of $64,301 in the same session that spot ETF flows finally flipp...

Bitcoin price faces new risk as big buyers lose conviction
Bitcoin’s largest buyers are no longer behaving like a reliable backstop for the largest cryptocurrency. The exchange-traded funds...

Bitcoin rises above $64,000 after Pakistan prime minister says Iran peace deal is near
Bitcoin traded above $64,000 on Saturday, supported by its strongest ETF inflows in a month and growing optimism around geopolitic...