XRP Price Holds Support – Indicators Show Risk of Downside Break
XRP price is holding gains above the $0.60 zone. The price could gain bearish momentum if there is a close below the $0.570 support zone. XRP is facing a major hurdle near the $0.6580 zone. The price is now trading below...
XRP price is holding gains above the $0.60 zone. The price could gain bearish momentum if there is a close below the $0.570 support zone.
- XRP is facing a major hurdle near the $0.6580 zone.
- The price is now trading below $0.640 and the 100 simple moving average (4 hours).
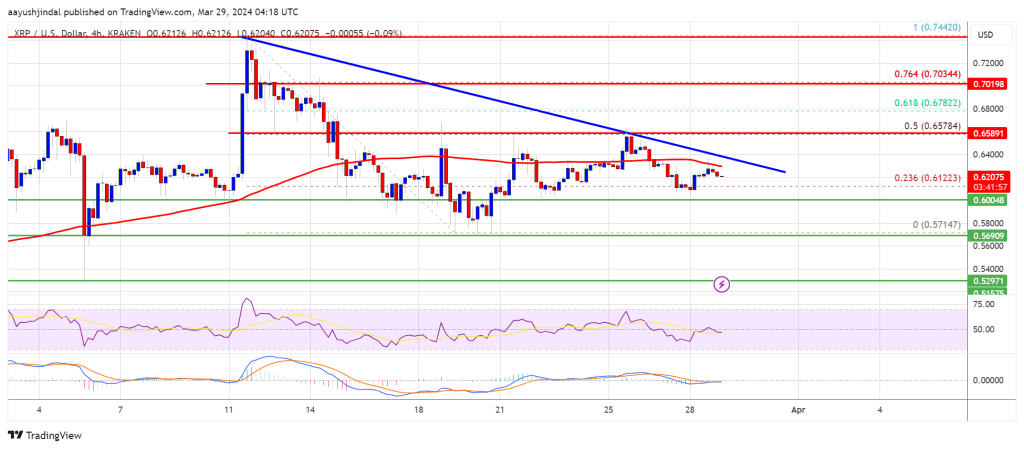
- There is a key bearish trend line forming with resistance near $0.640 on the 4-hour chart of the XRP/USD pair (data source from Kraken).
- The pair could gain bearish momentum if there is a close below the $0.5720 support.
After a steady decline, XRP price found support near the $0.5720 level. A low was formed at $0.5714 and the price started a fresh increase, like Bitcoin and Ethereum.
There was a move above the $0.5880 and $0.600 resistance levels. The price cleared the 23.6% Fib retracement level of the downward wave from the $0.7442 swing high to the $0.5714 low. The bulls pushed the price above the $0.620 resistance zone, but the bears are active near $0.640.
Ripple’s token price is now trading above $0.6320 and the 100 simple moving average (4 hours). On the upside, immediate resistance is near the $0.640 zone. There is also a key bearish trend line forming with resistance near $0.640 on the 4-hour chart of the XRP/USD pair.
The next key resistance is near $0.6580. It is close to the 50% Fib retracement level of the downward wave from the $0.7442 swing high to the $0.5714 low. A close above the $0.6580 resistance zone could spark a strong increase. The next key resistance is near $0.700. If the bulls remain in action above the $0.700 resistance level, there could be a rally toward the $0.7440 resistance. Any more gains might send the price toward the $0.800 resistance.
More Losses?If XRP fails to clear the $0.640 resistance zone, it could start another decline. Initial support on the downside is near the $0.600 zone.
The next major support is at $0.5720. If there is a downside break and a close below the $0.5720 level, the price might accelerate lower. In the stated case, the price could retest the $0.5250 support zone.
Technical Indicators
4-Hours MACD – The MACD for XRP/USD is now losing pace in the bullish zone.
4-Hours RSI (Relative Strength Index) – The RSI for XRP/USD is now above the 50 level.
Major Support Levels – $0.600, $0.5720, and $0.5250.
Major Resistance Levels – $0.640, $0.6580, and $0.700.
Original source
Read on NewsBTCRelated market context

Ethereum Price Prediction: ETH is Still Below Its 200 Week SMA, and Tom Lee Buying Spree Might End Soon
Ethereum price is trading above $1,700 after running for 5% today, and even our prediction model is calling for more leg higher. H...

Bitcoin Stabilizes Near Key Zone, But Glassnode Warns Capital Flows Remain Weak
Bitcoin’s rebound from the $60,000 area has given bulls something to work with, but Glassnode’s latest market read suggests the re...

BTC News Today: Bitcoin Climbs Toward $66K as Trump Reveals US-Iran Peace Deal
The renewed geopolitical optimism helped improve risk sentiment across financial markets, pushing Bitcoin back toward the $66,000...

Ethereum News: Last Chance to Buy Ethereum Under $2K? ETH USD Powers Up After Hormuz Peace Deal
In the latest Ethereum News, Ethereum ETH Price is trading at $1,739 up 4% in 24 hours, as risk assets catch a bid following the H...

Bitcoin Price Prediction: Bank of Japan Rate Hike and Piling Yen Shorts Threaten BTC
Bitcoin price is back above $65,000, gaining more than $3,000 in a day, although Washington helps, news from the other side of the...

Bitcoin Price and Crypto Stocks Surge as Iran Ceasefire, Strategy’s $100M Buy Collide With Fed Week
Bitcoin Magazine Bitcoin Price and Crypto Stocks Surge as Iran Ceasefire, Strategy’s $100M Buy Collide With Fed Week Bitcoin price...