XRP Price Next Chapter Could Be A Strong Move To The Upside
XRP price started a steady increase above $1.1650. The price is now consolidating gains and might aim for more gains above the $1.20 zone. XRP price started a steady increase above the $1.150 zone. The price is now tradi...
Archive context
Older archive item. Useful for background and entity history, but not a fresh market-moving signal.

XRP price started a steady increase above $1.1650. The price is now consolidating gains and might aim for more gains above the $1.20 zone.
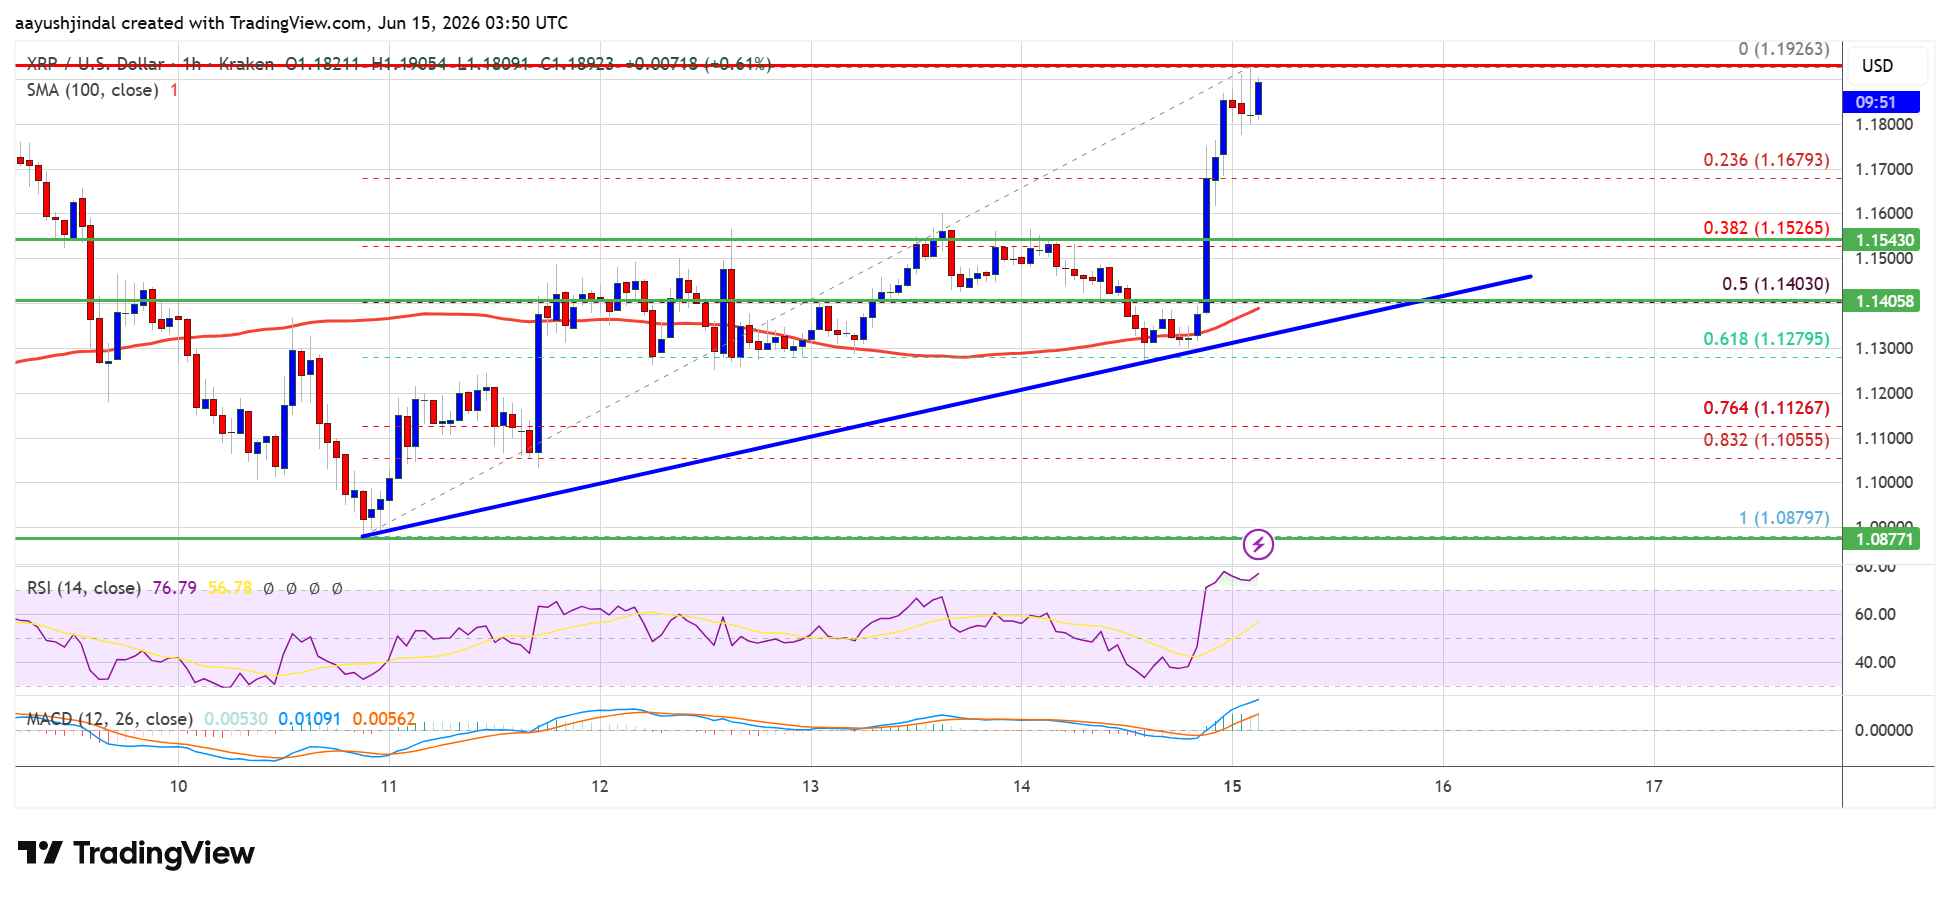
- XRP price started a steady increase above the $1.150 zone.
- The price is now trading above $1.160 and the 100-hourly Simple Moving Average.
- There is a bullish trend line forming with support at $0.140 on the hourly chart of the XRP/USD pair (data source from Kraken).
- The pair could continue to move up if it settles above $1.20.
XRP price started a fresh upward move above $1.1450 and $1.150, like Bitcoin and Ethereum. The price gained pace for a clear move above the $1.1680 resistance.
The bulls even pumped the price toward the $1.1880 zone. A high was formed at $1.1926, and the price started a consolidation phase above the 23.6% Fib retracement level of the upward move from the $1.0879 swing low to the $1.1926 high.
The price is now trading above $1.180 and the 100-hourly Simple Moving Average. Besides, there is a bullish trend line forming with support at $0.140 on the hourly chart of the XRP/USD pair.
If there is a fresh upward move, the price might face resistance near the $1.1920 level. The first major resistance is near the $1.1950 level, above which the price could rise and test $1.20. A clear move above the $1.20 resistance might send the price toward the $1.2150 resistance. Any more gains might send the price toward the $1.2220 resistance. The next major hurdle for the bulls might be near $1.2250.
Downside Correction?If XRP fails to clear the $1.20 resistance zone, it could start a fresh decline. Initial support on the downside is near the $1.1680 level. The next major support is near the $1.1550 level.
If there is a downside break and a close below the $1.1550 level, the price might continue to decline toward $1.1400, the trend line, and the 50% Fib retracement level of the upward move from the $1.0879 swing low to the $1.1926 high. The next major support sits near the $1.1280 zone, below which the price could continue lower toward $1.1120. The main support could be $1.080.
Technical Indicators
Hourly MACD – The MACD for XRP/USD is now gaining pace in the bullish zone.
Hourly RSI (Relative Strength Index) – The RSI for XRP/USD is now above the 50 level.
Major Support Levels – $1.1680 and $1.1400.
Major Resistance Levels – $1.1920 and $1.2000.
Why this matters
XRP is a tracked market entity in the DigitalMoneyBox archive, making this useful context for readers monitoring repeated mentions and follow-up coverage.
Original source
Read on NewsBTCRelated market context

Ethereum Price in Limbo as Bitmine Inches Away From Its 5% Supply Target
Ethereum price is trading at $1,880, down 3.3% on the day after slipping from recent highs. The market remains caught between stea...

Bitcoin holds near $65,000 as AI stocks slide, but Fed decision looms over crypto’s next move
Bitcoin stayed resilient near $65,000 even as Nvidia and AI stocks fell. This week's Fed decision and PCE data could determine whe...

Google Gemini AI Predicts Why XRP Could Outperform Every Crypto by End of 2026
Google Gemini AI language on this predicts is unusually direct. Trading near $1.08, XRP sits at the precipice of a major instituti...

Arthur Hayes Holds 7,213 ETH as FOMC Jitters Drives Ethereum Price Drop
Arthur Hayes added 3,298 ETH worth $6.39 million on July 28, roughly three hours before Ethereum’s spot price slid from $1,960 to...

South Korea’s Stock Market Triggered 8th Circuit Breaker of 2026: Bitcoin Liquidated 3 Times Near $64,000
Bitcoin News: BTC price is trading at $63,582 on July 28, down 2.12% in the past 24 hours, and the level that keeps breaking trade...

Mark Zuckerberg Meta AI Predicts Bitcoin Will Cross This Price by Next 60 Days
Mark Zuckerberg Meta AI predicts in weeks here rather than months. From $64,800, the price prediction is a 60 day breakout with a...