XRP Price Prediction: Bulls Could Aim $0.4 or Higher
Ripple is gaining pace above the $0.350 resistance zone against the US Dollar. XRP price could rise further if it clears the $0.3720 resistance zone. Ripple is currently rising above the $0.35 resistance zone against the...

Ripple is gaining pace above the $0.350 resistance zone against the US Dollar. XRP price could rise further if it clears the $0.3720 resistance zone.
- Ripple is currently rising above the $0.35 resistance zone against the US dollar.
- The price is now trading above $0.350 and the 100 simple moving average (4-hours).
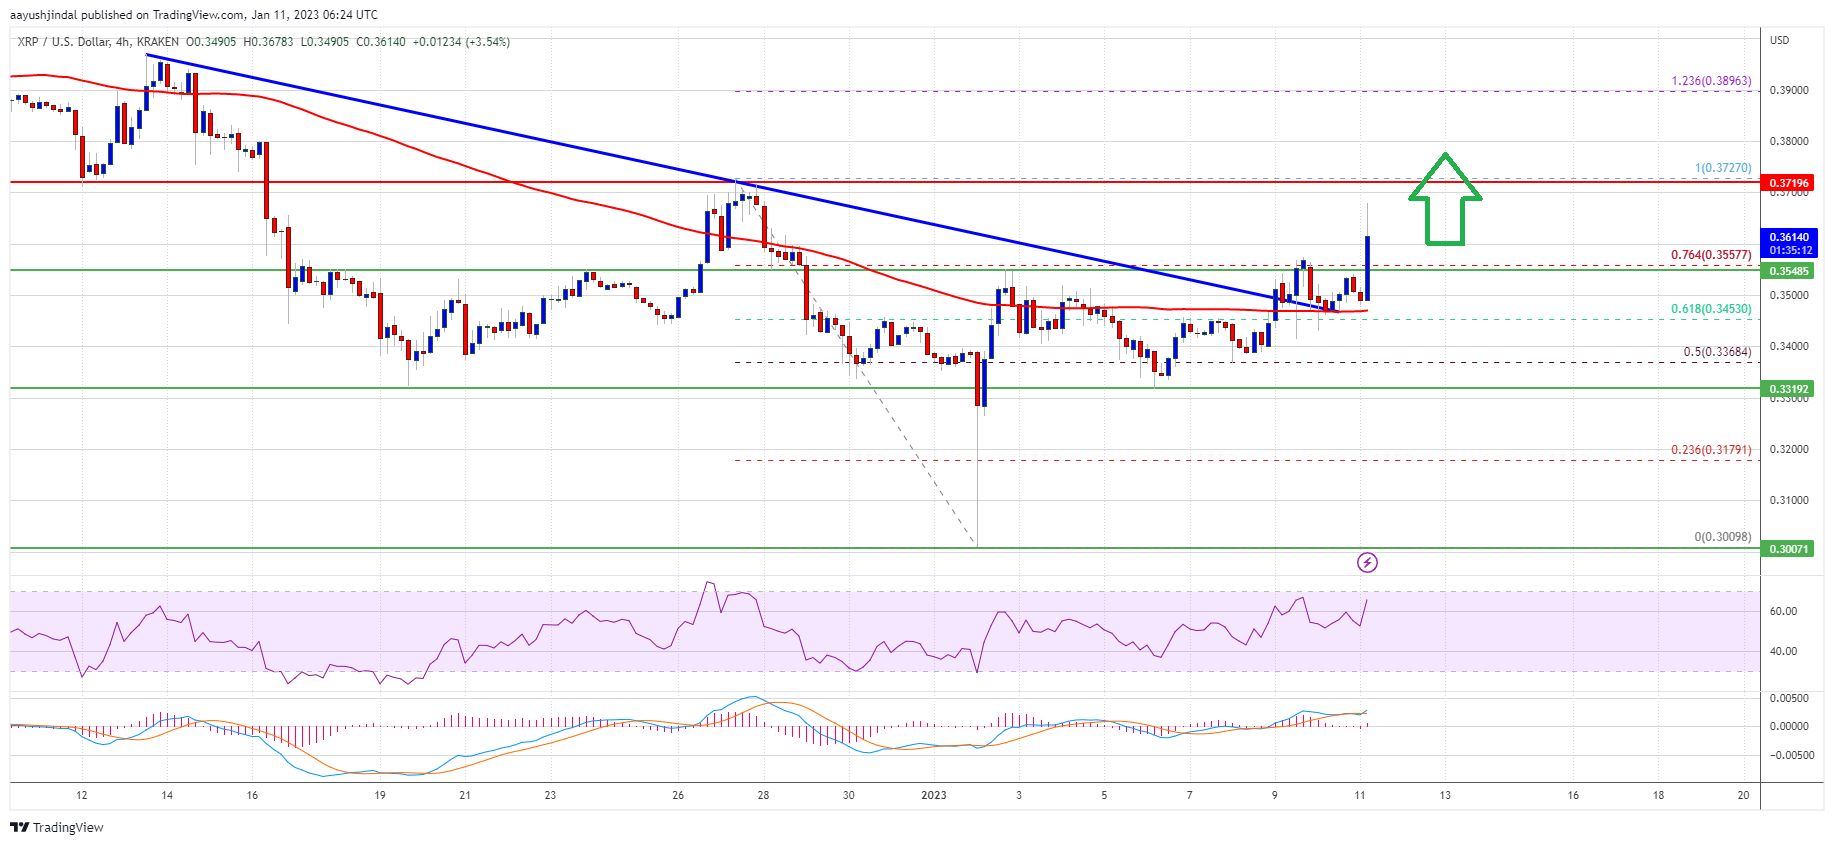
- There was a break above a crucial bearish trend line with resistance near $0.3495 on the 4-hours chart of the XRP/USD pair (data source from Kraken).
- The pair could rise further higher if there is a clear move above the $0.3720 resistance zone.
After a sharp decline, ripple’s XRP found support near the $0.3000 zone against the US Dollar. The price formed a base above the $0.3050 level before it started a recovery wave.
There was a decent increase above the $0.3250 and $0.3300 resistance levels. Besides, there was a break above a crucial bearish trend line with resistance near $0.3495 on the 4-hours chart of the XRP/USD pair. The upward move gained pace above the $0.350 level.
The price is now trading above the 76.4% Fib retracement level of the main drop from the $0.3727 swing high to $0.3009 low. It is also trading above $0.350 and the 100 simple moving average (4-hours), outperforming bitcoin and ethereum.
An immediate resistance is near the $0.372 zone. The next key resistance is near the $0.390 level. It is near the 1.236 Fib extension level of the main drop from the $0.3727 swing high to $0.3009 low.
Source: XRPUSD on TradingView.com
A successful break above the $0.390 resistance might send the price towards the $0.400 resistance. Any more gains might send the price towards the $0.432 level in the coming days.
Fresh Decline in XRP?If ripple fails to clear the $0.372 resistance zone, it could start a downside correction. An initial support on the downside is near the $0.355 level.
The next major support is near $0.345 and the 100 simple moving average (4-hours). If there is a downside break and close below the $0.345 level, xrp price could extend losses. In the stated case, the price could even decline below the $0.325 support.
Technical Indicators
4-Hours MACD – The MACD for XRP/USD is now gaining pace in the bullish zone.
4-Hours RSI (Relative Strength Index) – The RSI for XRP/USD is now above the 50 level.
Major Support Levels – $0.355, $0.345 and $0.325.
Major Resistance Levels – $0.372, $0.390 and $0.400.
Original source
Read on NewsBTCRelated market context

Bitcoin price challenges $64,000 weekend wall – needing a breakout or risk a deeper correction
Bitcoin reclaimed $64,000 on June 12 and touched an intraday high of $64,301 in the same session that spot ETF flows finally flipp...

Elon Musk SpaceX AI Predicts Incredible Bitcoin Price For Next 30 Days
Here is the thing about capitulation calls. They only sound smart in hindsight. Right now, with Bitcoin price scraping along the l...

Uranium Holds Above $85 as Mining ETF Rebounds From June Sell-Off
The latest charts display that the market is divided into stable physical prices and uranium shares trying to regain momentum afte...

Standard Chartered Says Bitcoin Bottomed Near $59,000 As Crypto Winter Ends
TL;DR Standard Chartered’s Geoffrey Kendrick reportedly says Bitcoin’s $59,000 area marked the cycle bottom. The note cites SpaceX...

Tether USDT Briefly Overtakes Ethereum in Market Cap: A $187B Wake-Up Call
For a few hours, earlier this week, Tether USDT stablecoin held a higher market cap than Ethereum, the first time that has happene...
SpaceX’s IPO exposes the first crack in tokenized stocks – fragmented ownership and allocation
SpaceX priced its IPO at $135 per share on June 11, raised $75 billion in the largest public offering in history, and opened on Na...