XRP Price Prediction – Can 100 SMA Trigger Another Steady Increase
XRP price is correcting gains from the $0.570 resistance. The price is stable above the $0.5240 support and might aim for a fresh increase in the near term. XRP started a decent increase and climbed above the $0.550 resi...
XRP price is correcting gains from the $0.570 resistance. The price is stable above the $0.5240 support and might aim for a fresh increase in the near term.
- XRP started a decent increase and climbed above the $0.550 resistance.
- The price is now trading above $0.5250 and the 100 simple moving average (4 hours).
- There is a key bullish trend line forming with support at $0.5320 on the 4-hour chart of the XRP/USD pair (data source from Kraken).
- The pair could start another increase if the bulls defend the $0.5240 support.
Recently, XRP price started a decent increase above the $0.5250 resistance zone. The bulls even pushed the price above the $0.550 resistance zone before the bears appeared.
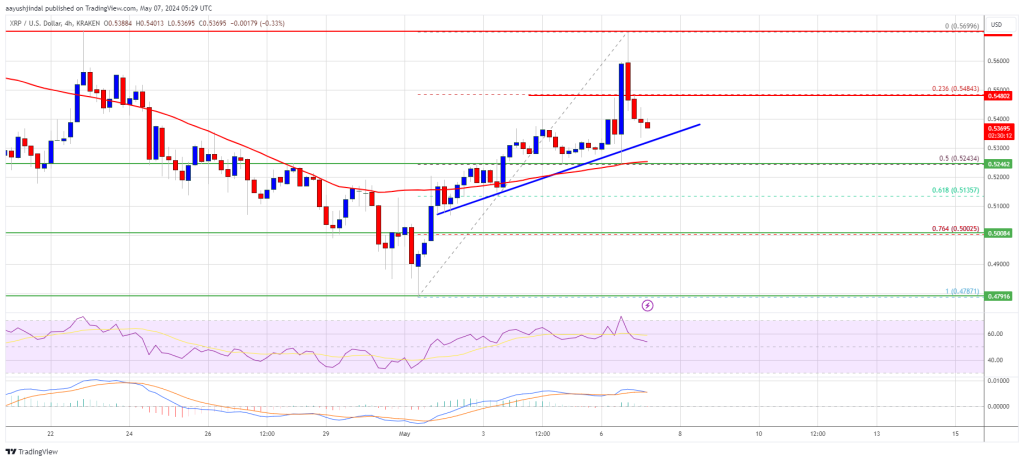
A high was formed at $0.5699 before there was a pullback like Bitcoin and Ethereum. The price dipped below the $0.550 support zone. The price declined below the 23.6% Fib retracement level of the upward move from the $0.4787 swing low to the $0.5699 high.
However, the price is now stable above $0.5250 and the 100 simple moving average (4 hours). There is also a key bullish trend line forming with support at $0.5320 on the 4-hour chart of the XRP/USD pair.
Source: XRPUSD on TradingView.com
Immediate resistance is near the $0.5480 level. The first key resistance is near $0.570. A close above the $0.570 resistance zone could spark a strong increase. The next key resistance is near $0.5850. If the bulls remain in action above the $0.5850 resistance level, there could be a rally toward the $0.620 resistance. Any more gains might send the price toward the $0.680 resistance.
More Losses?If XRP fails to clear the $0.5480 resistance zone, it could start another decline. Initial support on the downside is near the $0.5320 level and the trend line.
The next major support is at $0.5240 and the 100 simple moving average (4 hours). If there is a downside break and a close below the $0.5240 level, the price might accelerate lower. In the stated case, the price could retest the $0.50 support zone.
Technical Indicators
4-Hours MACD – The MACD for XRP/USD is now losing pace in the bullish zone.
4-Hours RSI (Relative Strength Index) – The RSI for XRP/USD is now above the 50 level.
Major Support Levels – $0.5320, $0.5240, and $0.500.
Major Resistance Levels – $0.5480, $0.570, and $0.600.
Original source
Read on NewsBTCRelated market context

Ethereum Price Prediction: ETH is Still Below Its 200 Week SMA, and Tom Lee Buying Spree Might End Soon
Ethereum price is trading above $1,700 after running for 5% today, and even our prediction model is calling for more leg higher. H...

Bitcoin Stabilizes Near Key Zone, But Glassnode Warns Capital Flows Remain Weak
Bitcoin’s rebound from the $60,000 area has given bulls something to work with, but Glassnode’s latest market read suggests the re...

BTC News Today: Bitcoin Climbs Toward $66K as Trump Reveals US-Iran Peace Deal
The renewed geopolitical optimism helped improve risk sentiment across financial markets, pushing Bitcoin back toward the $66,000...

Ethereum News: Last Chance to Buy Ethereum Under $2K? ETH USD Powers Up After Hormuz Peace Deal
In the latest Ethereum News, Ethereum ETH Price is trading at $1,739 up 4% in 24 hours, as risk assets catch a bid following the H...

Bitcoin Price Prediction: Bank of Japan Rate Hike and Piling Yen Shorts Threaten BTC
Bitcoin price is back above $65,000, gaining more than $3,000 in a day, although Washington helps, news from the other side of the...

Ethereum Research Proposal Targets Post-Quantum Wallet Security At Low Gas Cost
A new Ethereum Research proposal is putting post-quantum wallet security back in focus, outlining a practical way to verify quantu...