XRP Price Prediction: Can Bulls Pump It Again To $0.75
XRP price found support at $0.5685 and started a fresh increase. The bulls could gain strength if they manage to push the price above $0.6560. XRP found is attempting a fresh increase from the $0.5680 support zone. The p...

XRP price found support at $0.5685 and started a fresh increase. The bulls could gain strength if they manage to push the price above $0.6560.
- XRP found is attempting a fresh increase from the $0.5680 support zone.
- The price is now trading above $0.630 and the 100 simple moving average (4 hours).
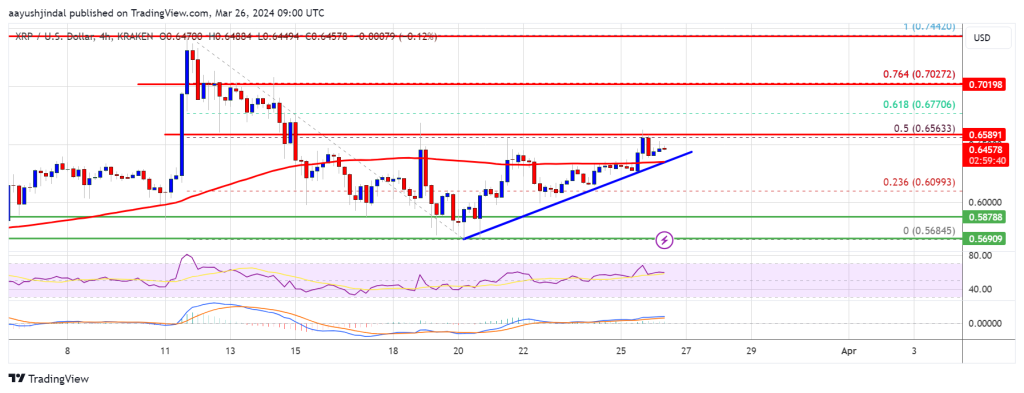
- There is a key bullish trend line forming with support near $0.6440 on the 4-hour chart of the XRP/USD pair (data source from Kraken).
- The pair could start a fresh rally if there is a close above the $0.6560 resistance zone.
After a major decline, XRP price found support near the $0.5685 level. A low was formed at $0.5685 and the price started a fresh increase, like Bitcoin and Ethereum.
There was a move above the $0.5850 and $0.600 resistance levels. The price cleared the 23.6% Fib retracement level of the downward wave from the $0.7442 swing high to the $0.5686 low. The bulls pushed the price above the $0.640 resistance zone.
Ripple’s token price is now trading above $0.630 and the 100 simple moving average (4 hours). On the upside, immediate resistance is near the $0.6560 zone. It is close to the 50% Fib retracement level of the downward wave from the $0.7442 swing high to the $0.5686 low.
Source: XRPUSD on TradingView.com
The first key resistance is near $0.700, above which the price could rise toward the $0.7320 resistance. A close above the $0.7320 resistance zone could spark a strong increase. The next key resistance is near $0.7440. If the bulls remain in action above the $0.7440 resistance level, there could be a rally toward the $0.800 resistance. Any more gains might send the price toward the $0.820 resistance.
Another Drop?If XRP fails to clear the $0.6560 resistance zone, it could start another decline. Initial support on the downside is near the $0.640 zone and the trend line.
The next major support is at $0.620. If there is a downside break and a close below the $0.620 level, the price might accelerate lower. In the stated case, the price could retest the $0.5685 support zone.
Technical Indicators
4-Hours MACD – The MACD for XRP/USD is now losing pace in the bullish zone.
4-Hours RSI (Relative Strength Index) – The RSI for XRP/USD is now above the 50 level.
Major Support Levels – $0.640, $0.620, and $0.5685.
Major Resistance Levels – $0.6560, $0.700, and $0.7440.
Original source
Read on NewsBTCRelated market context

Bitcoin Stabilizes Near Key Zone, But Glassnode Warns Capital Flows Remain Weak
Bitcoin’s rebound from the $60,000 area has given bulls something to work with, but Glassnode’s latest market read suggests the re...

BTC News Today: Bitcoin Climbs Toward $66K as Trump Reveals US-Iran Peace Deal
The renewed geopolitical optimism helped improve risk sentiment across financial markets, pushing Bitcoin back toward the $66,000...
Crypto News, June 16: US-Iran Deal Oddity, FTX Claim Day, ETH USD Season Drawing Closer
We start today’s crypto news with a few oddities in the US-Iran deal as it closed faster than most expected, while the bombing tal...

Bitcoin Price and Crypto Stocks Surge as Iran Ceasefire, Strategy’s $100M Buy Collide With Fed Week
Bitcoin Magazine Bitcoin Price and Crypto Stocks Surge as Iran Ceasefire, Strategy’s $100M Buy Collide With Fed Week Bitcoin price...
Lummis Links Bitcoin to $39.2T US Debt Crisis as CLARITY Act Nears Senate Floor
Senator Cynthia Lummis publicly tied Bitcoin to America’s $39.2 trillion national debt crisis on June 15, positioning the asset as...

Ethereum Research Proposal Targets Post-Quantum Wallet Security At Low Gas Cost
A new Ethereum Research proposal is putting post-quantum wallet security back in focus, outlining a practical way to verify quantu...