XRP Price Prediction: Ripple Bears Target Fresh Lows As Sentiment Dips
Ripple is struggling to recover above the $0.48 resistance against the US Dollar. XRP price could extend losses if there is a close below the $0.44 support. Ripple started a fresh decline from the $0.500 zone against the...
Archive context
Older archive item. Useful for background and entity history, but not a fresh market-moving signal.

Ripple is struggling to recover above the $0.48 resistance against the US Dollar. XRP price could extend losses if there is a close below the $0.44 support.
- Ripple started a fresh decline from the $0.500 zone against the US dollar.
- The price is now trading below $0.488 and the 100 simple moving average (4 hours).
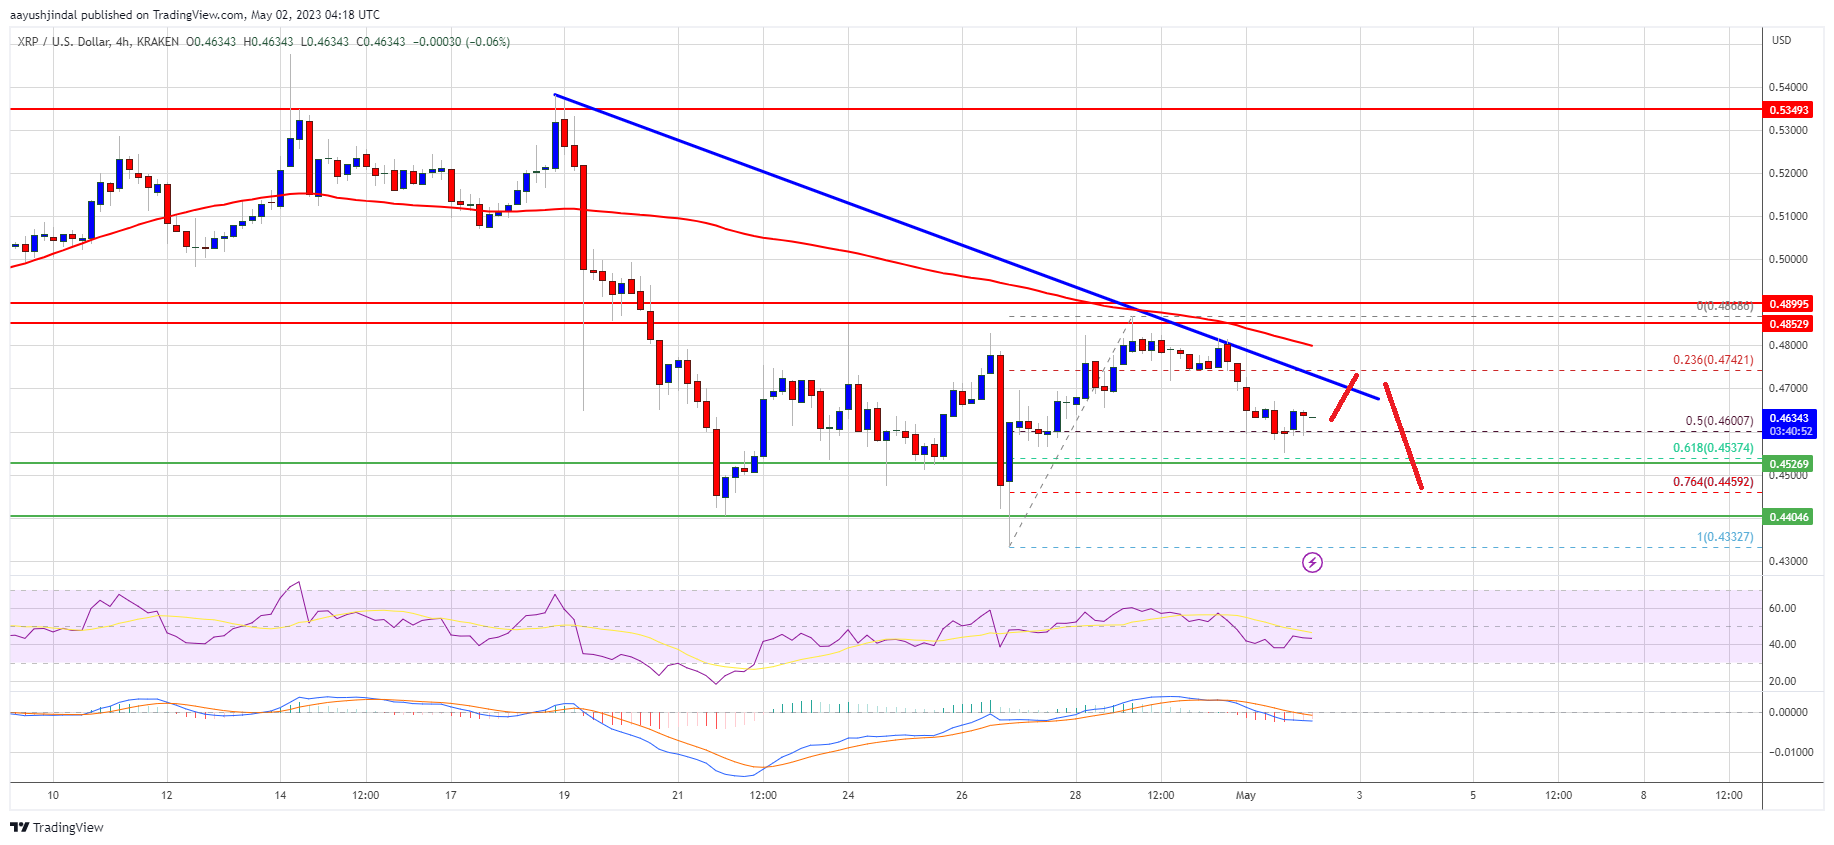
- There is a key bearish trend line forming with resistance near $0.470 on the 4-hour chart of the XRP/USD pair (data source from Kraken).
- The pair might decline further if it stays below the $0.488 and $0.500 resistance levels.
After a minor upward move, Ripple’s XRP struggled to gain pace for a move above the $0.50 resistance against the US Dollar. A high is formed near $0.4868 and the price is moving lower, similar to Bitcoin and Ethereum.
There was a clear move below the $0.475 and $0.470 support levels. The price is now trading near the 50% Fib retracement level of the upward move from the $0.4332 swing low to the $0.4868 high. It is now trading below $0.488 and the 100 simple moving average (4 hours).
Initial resistance is near the $0.470 zone. There is also a key bearish trend line forming with resistance near $0.470 on the 4-hour chart of the XRP/USD pair.
Source: XRPUSD on TradingView.com
The first major resistance is near the $0.480 level or the 100 simple moving average (4 hours). The main resistance is near the $0.488 level. A successful break above the $0.480 and $0.488 resistance levels might send the price toward the $0.520 resistance. Any more gains might send the price toward the $0.535 resistance.
More Losses in XRP?If ripple fails to clear the $0.480 resistance zone, it could continue to move down. Initial support on the downside is near the $0.454 zone or the 61.8% Fib retracement level of the upward move from the $0.4332 swing low to the $0.4868 high.
The next major support is near $0.440. If there is a downside break and a close below the $0.440 level, XRP’s price could extend losses. In the stated case, the price could test the $0.400 support zone.
Technical Indicators
4-Hours MACD – The MACD for XRP/USD is now gaining pace in the bearish zone.
4-Hours RSI (Relative Strength Index) – The RSI for XRP/USD is now below the 50 level.
Major Support Levels – $0.454, $0.440, and $0.400.
Major Resistance Levels – $0.480, $0.488, and $0.500.
Why this matters
This altcoin story adds another data point to the current market tape and is useful when read alongside nearby source coverage.
Original source
Read on NewsBTCRelated market context

Bitcoin (BTC) Price Prediction: BTC Holds $63K Support—Can Rising Active Addresses Offset Bearish Technical Signals?
Although the BTC price has remained near a key support zone, recent chart signals and Strategy’s sale of a portion of its Bitcoin...

XRP Price Prediction: Volume and ETF Inflow Send Ripple Token Higher
XRP price pushed above the $1.14 resistance area after buyers stepped in with heavy volume and bullish prediction. The token climb...

Ethereum Price Prediction: Vitalik Hints at 3-4 Years Long ETH Rebuild
Ethereum price is trading at $1,780 as Vitalik Buterin revealed the network’s biggest roadmap since the Merge, which somehow sends...

SEC Closes Consensys Ethereum 2.0 Probe, Removing A Major Staking Overhang
Ethereum has one less regulatory cloud hanging over it after Consensys said the U.S. Securities and Exchange Commission has closed...

Dormant $1.9M Bitcoin tied to New York lawsuit moves after nearly 15 years
A Bitcoin address dormant for nearly 15 years moved $1.9 million in BTC as a New York lawsuit seeks ownership of thousands of inac...

Sui DeFi TVL Breaks $1 Billion As Move-Based Chains Fight For Liquidity
Sui has crossed the $1 billion total value locked mark on DeFiLlama, giving the Move-based network a clearer claim to serious DeFi...