XRP Price Prediction: Ripple Plunges to $0.42: Can Bulls Save the Day?
Ripple is gaining bearish momentum below $0.45 against the US Dollar. XRP price is at risk of more losses if it breaks the $0.40 support. Ripple started a fresh decline from the $0.470 zone against the US dollar. The pri...
Archive context
Older archive item. Useful for background and entity history, but not a fresh market-moving signal.

Ripple is gaining bearish momentum below $0.45 against the US Dollar. XRP price is at risk of more losses if it breaks the $0.40 support.
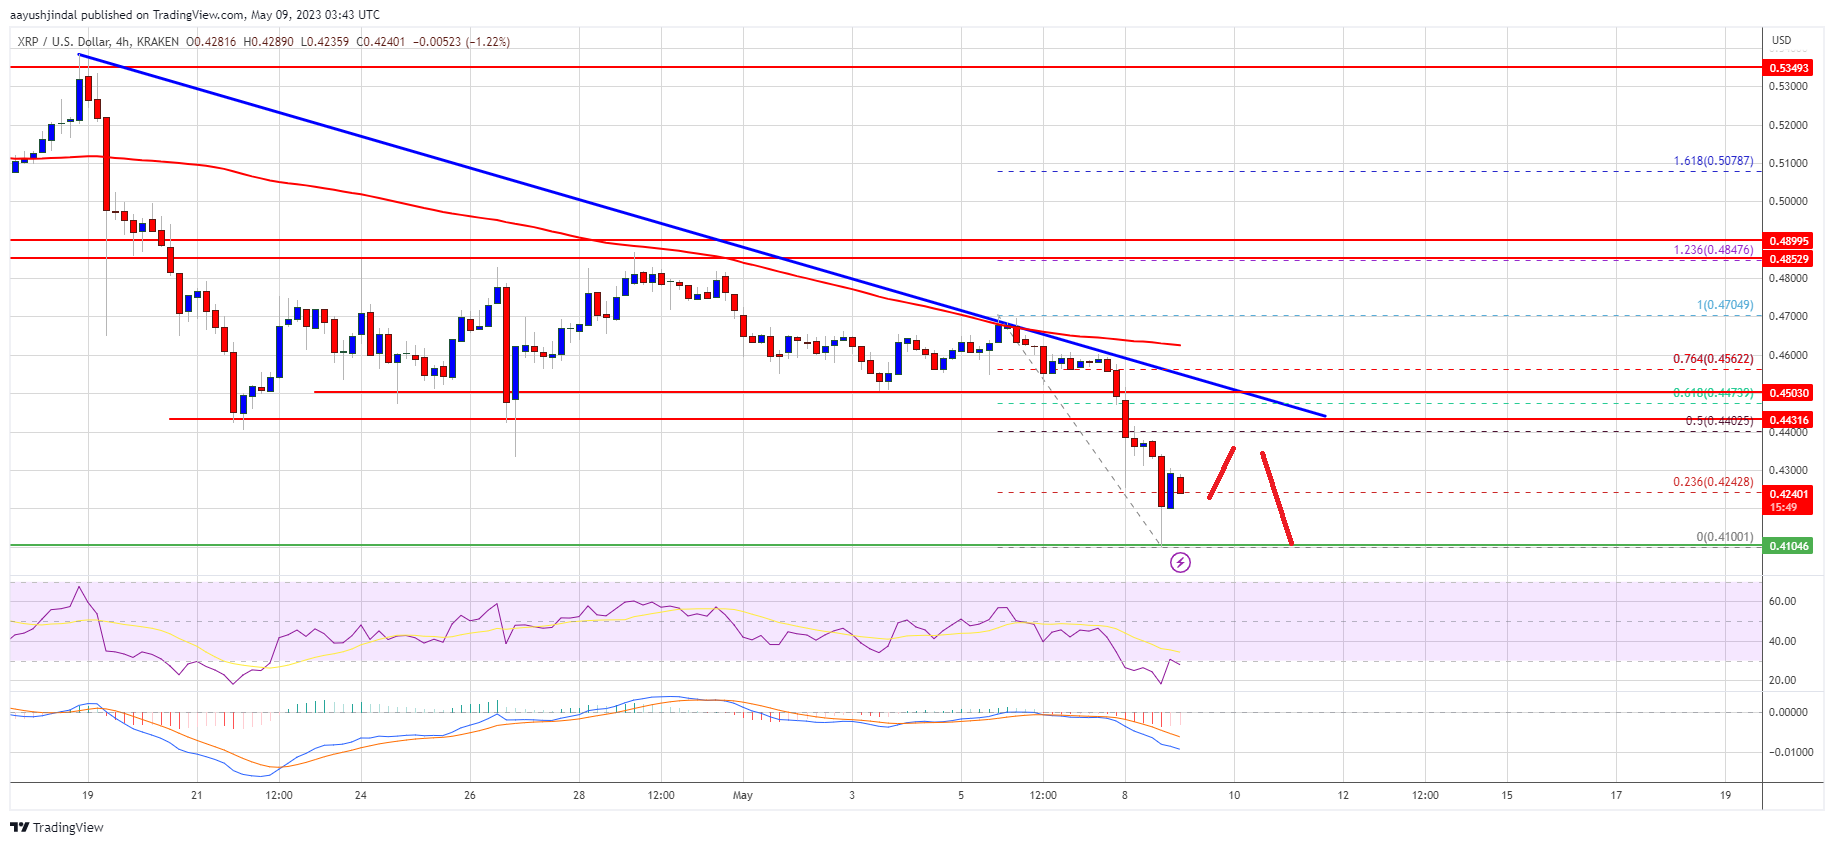
- Ripple started a fresh decline from the $0.470 zone against the US dollar.
- The price is now trading below $0.450 and the 100 simple moving average (4 hours).
- There is a connecting bearish trend line forming with resistance near $0.450 on the 4-hour chart of the XRP/USD pair (data source from Kraken).
- The pair might decline further if it stays below the $0.445 and $0.450 resistance levels.
This past week, Ripple’s XRP attempted a fresh increase above the $0.465 level against the US Dollar. However, the bears remained active near the $0.47 level. A high was formed near $0.4704 and the price declined, similar to Bitcoin and Ethereum.
There was a clear move below the $0.450 and $0.445 support levels. A low is formed near $0.4100 and the price is now consolidating losses. It is trading below $0.450 and the 100 simple moving average (4 hours). There is also a connecting bearish trend line forming with resistance near $0.450 on the 4-hour chart of the XRP/USD pair.
Initial resistance is near the $0.440 zone. It is close to the 50% Fib retracement level of the recent decline from the $0.4704 swing high to the $0.4100 low.
Source: XRPUSD on TradingView.com
The first major resistance is near the $0.450 level and the trend line. The 61.8% Fib retracement level of the recent decline from the $0.4704 swing high to the $0.4100 low is also near the trend line. A successful break above the $0.445 and $0.450 resistance levels might send the price toward the $0.470 resistance. Any more gains might call for a test of the $0.535 resistance.
More Losses in XRP?If ripple fails to clear the $0.450 resistance zone, it could continue to move down. Initial support on the downside is near the $0.410 zone.
The next major support is near $0.40. If there is a downside break and a close below the $0.40 level, XRP’s price could extend losses. In the stated case, the price could test the $0.380 support zone.
Technical Indicators
4-Hours MACD – The MACD for XRP/USD is now gaining pace in the bearish zone.
4-Hours RSI (Relative Strength Index) – The RSI for XRP/USD is now below the 50 level.
Major Support Levels – $0.410, $0.400, and $0.380.
Major Resistance Levels – $0.445, $0.450, and $0.470.
Why this matters
This altcoin story adds another data point to the current market tape and is useful when read alongside nearby source coverage.
Original source
Read on NewsBTCRelated market context

Bitcoin (BTC) Price Prediction: BTC Holds $63K Support—Can Rising Active Addresses Offset Bearish Technical Signals?
Although the BTC price has remained near a key support zone, recent chart signals and Strategy’s sale of a portion of its Bitcoin...

XRP Price Prediction: Volume and ETF Inflow Send Ripple Token Higher
XRP price pushed above the $1.14 resistance area after buyers stepped in with heavy volume and bullish prediction. The token climb...

Ethereum (ETH) Price Prediction: ETH Holds Near $1,780 as Bulls Eye $1,860–$1,950, but $1,609 Remains Key Invalidation
Ethereum price is trading near $1,779 after a mixed 24-hour session, according to Brave New Coin data. ETH is down around 0.76% on...

Solana Price Prediction: SOL Holds Near $81 as Breakout Setup Points to $87, but Whale Flows Keep Risk Active
Solana price is back in focus after a sharp recovery pushed SOL towards the $81 area. The move has improved short-term momentum, e...

Hyperliquid (HYPE) Price Prediction: Symmetrical Triangle Breakout Puts $77 Target Back in Focus
The breakout comes after several sessions of price compression, with HYPE continuing to trade within a broader technical structure...

Bitcoin miner bottom signal now depends on who survives weak mining profits
A Bitcoin miner-stress signal circulating on X has fallen into a zone analysts associate with severe miner pressure, putting a fam...