XRP Price Rallies 15%, Why Ripple Could Outperform Bitcoin and Ethereum
Ripple started a strong increase above the $0.350 resistance against the US Dollar. XRP price is now attempting a key upside break above the $0.380 resistance. Ripple started a fresh increase from the key $0.320 support...

Ripple started a strong increase above the $0.350 resistance against the US Dollar. XRP price is now attempting a key upside break above the $0.380 resistance.
- Ripple started a fresh increase from the key $0.320 support zone against the US dollar.
- The price is now trading below $0.400 and the 100 simple moving average (4-hours).
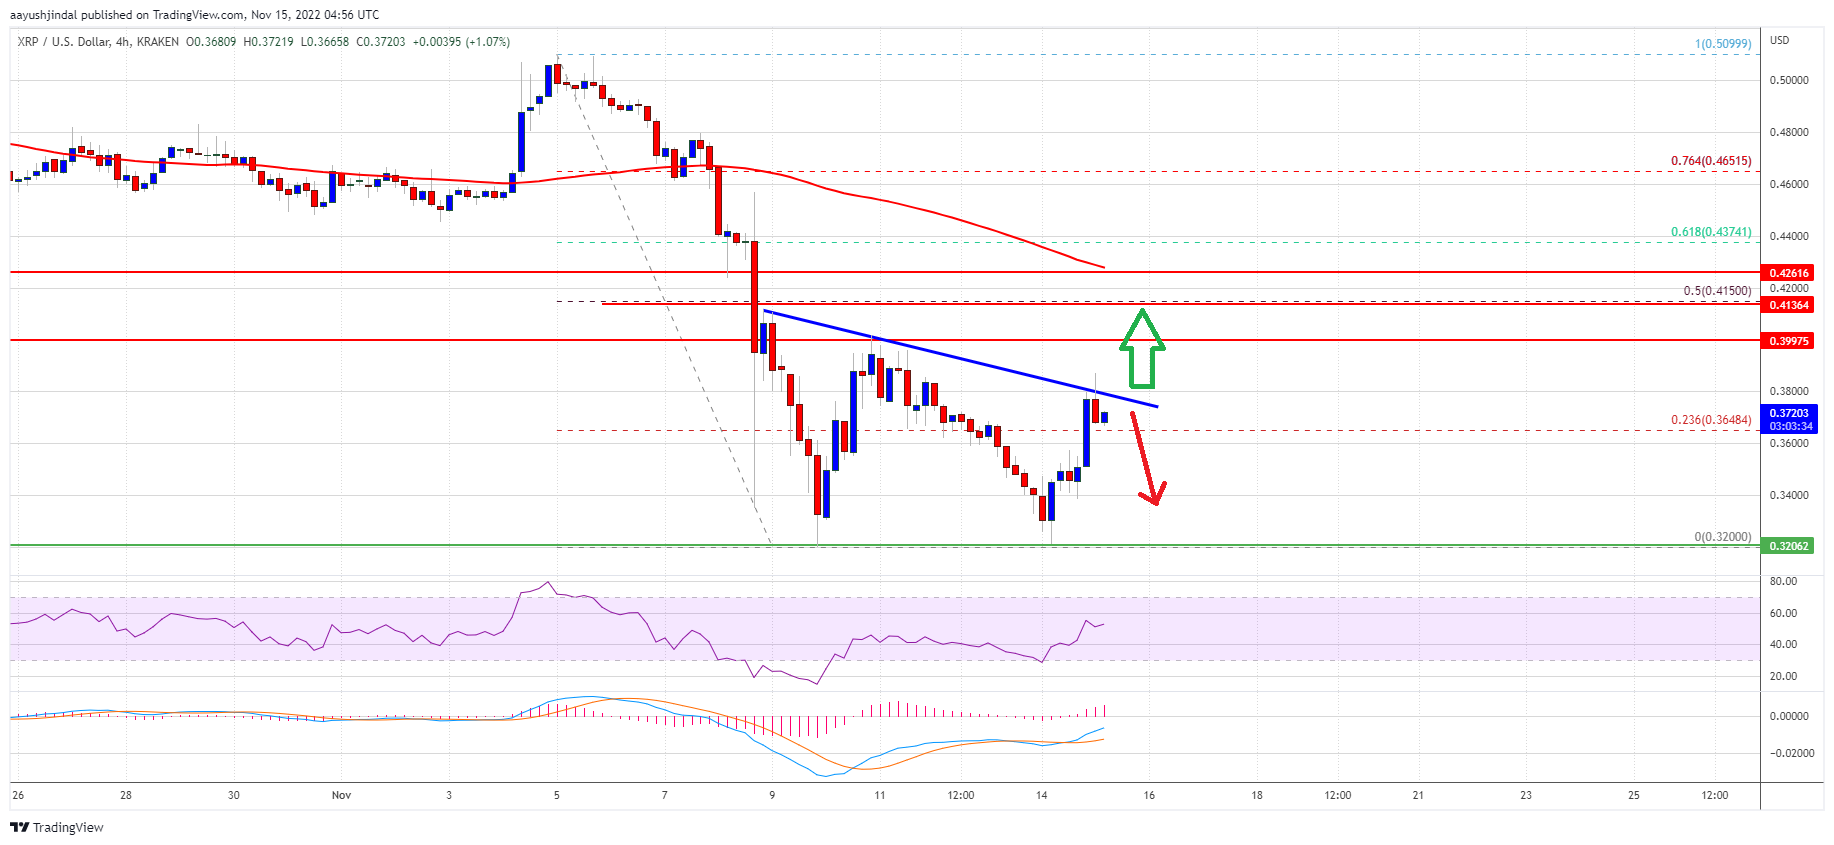
- There is a major bearish trend line forming with resistance near $0.380 on the 4-hours chart of the XRP/USD pair (data source from Kraken).
- The pair could start a strong increase if it clears the $0.38 resistance zone.
After a sharp decline, ripple’s XRP found support near $0.320 against the US Dollar. The bears made two attempts to push the price below the $0.32 support, but they failed.
The recent low was formed near $0.32 before there was a fresh increase. XRP price climbed over 15% and cleared the $0.35 resistance, outperforming bitcoin and ethereum. The price climbed above the 23.6% Fib retracement level of the downward move from the $0.5099 swing high to $0.3200 swing low.
The price gained pace for a move above the $0.360 resistance. However, it is now trading below $0.400 and the 100 simple moving average (4-hours). It is now facing hurdles near $0.380. There is also a major bearish trend line forming with resistance near $0.380 on the 4-hours chart of the XRP/USD pair.
Source: XRPUSD on TradingView.com
A successful break above the $0.380 and $0.385 resistance levels could spark another rally. The next key resistance is near the $0.415 level. It is near the 50% Fib retracement level of the downward move from the $0.5099 swing high to $0.3200 swing low. Any more gains might send the price towards the $0.44 level.
Dips Limited in XRP?If ripple fails to clear the $0.380 resistance zone, it could start a downside correction. An initial support on the downside is near the $0.365 level.
The next major support is near $0.342. If there is a downside break and close below the $0.342 level, xrp price could extend losses. In the stated case, the price could even decline below the $0.320 support.
Technical Indicators
4-Hours MACD – The MACD for XRP/USD is now gaining pace in the bullish zone.
4-Hours RSI (Relative Strength Index) – The RSI for XRP/USD is now above the 50 level.
Major Support Levels – $0.365, $0.342 and $0.320.
Major Resistance Levels – $0.380, $0.385 and $0.415.
Original source
Read on NewsBTCRelated market context

Uranium Holds Above $85 as Mining ETF Rebounds From June Sell-Off
The latest charts display that the market is divided into stable physical prices and uranium shares trying to regain momentum afte...

Bitcoin price challenges $64,000 weekend wall – needing a breakout or risk a deeper correction
Bitcoin reclaimed $64,000 on June 12 and touched an intraday high of $64,301 in the same session that spot ETF flows finally flipp...

Bitcoin Mining Cost Model Points To $47,000 Floor, But Analysts Urge Caution
TL;DR Crypto Rover says Bitcoin has never bottomed below electrical production cost, currently estimated at $47,000. Mining-cost m...

Standard Chartered Says Bitcoin Bottomed Near $59,000 As Crypto Winter Ends
TL;DR Standard Chartered’s Geoffrey Kendrick reportedly says Bitcoin’s $59,000 area marked the cycle bottom. The note cites SpaceX...

Bitcoin rises above $64,000 after Pakistan prime minister says Iran peace deal is near
Bitcoin traded above $64,000 on Saturday, supported by its strongest ETF inflows in a month and growing optimism around geopolitic...

Are 24/7 CME Bitcoin futures a volatility cure — or a new leverage trap?
Wall Street got to trade Bitcoin around the clock just in time to watch the market fall apart. CME Group launched 24/7 trading for...