XRP Price Rebound Faces Trouble, Downside Pressure Starts Building Again
XRP price started a recovery wave above $1.360 and $1.3620. The price is now consolidating and might aim for a fresh move if it clears $1.3940. XRP price started a recovery wave above the $1.3620 zone. The price is now t...
Archive context
Older archive item. Useful for background and entity history, but not a fresh market-moving signal.

XRP price started a recovery wave above $1.360 and $1.3620. The price is now consolidating and might aim for a fresh move if it clears $1.3940.
- XRP price started a recovery wave above the $1.3620 zone.
- The price is now trading below $1.3850 and the 100-hourly Simple Moving Average.
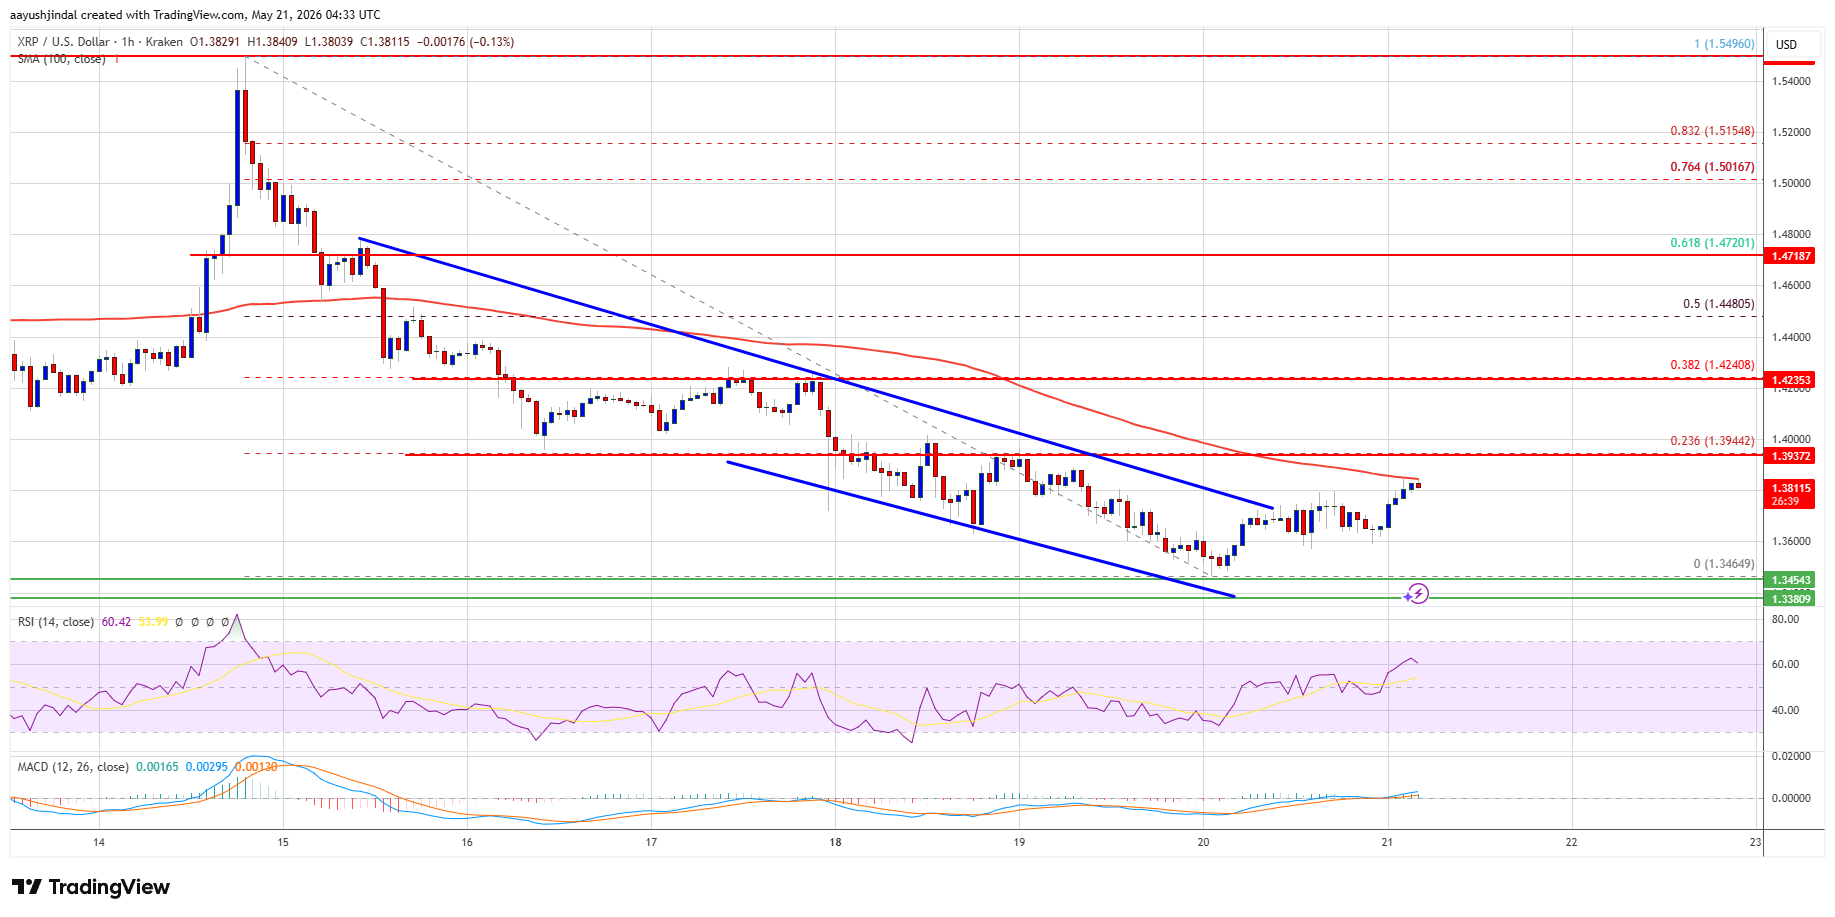
- There was a break above a declining channel with resistance at $1.380 on the hourly chart of the XRP/USD pair (data source from Kraken).
- The pair could continue to move up if it settles above $1.3940.
XRP price remained supported above $1.3450 and started a recovery wave, like Bitcoin and Ethereum. The price was able to climb above $1.3550 and $1.360 to enter a short-term positive zone.
More importantly, there was a break above a declining channel with resistance at $1.380 on the hourly chart of the XRP/USD pair. However, the bears could be active near the $1.3820 zone and the 23.6% Fib retracement level of the downward move from the $1.5495 swing high to the $1.3465 swing low.
The price is now trading below $1.3850 and the 100-hourly Simple Moving Average. If there is a fresh upward move, the price might face resistance near the $1.3850 level. The first major resistance is near the $1.3940 level.
A close above $1.3940 could send the price to $1.420. The next hurdle sits at $1.4720 or the 61.8% Fib retracement level of the downward move from the $1.5495 swing high to the $1.3465 swing low. A clear move above the $1.4720 resistance might send the price toward the $1.50 resistance. Any more gains might send the price toward the $1.520 resistance.
Another Drop?If XRP fails to clear the $1.3940 resistance zone, it could start a fresh decline. Initial support on the downside is near the $1.3620 level. The next major support is near the $1.3550 level.
If there is a downside break and a close below the $1.3550 level, the price might continue to decline toward $1.3450. The next major support sits near the $1.3350 zone, below which the price could continue lower toward $1.320.
Technical Indicators
Hourly MACD – The MACD for XRP/USD is now gaining pace in the bullish zone.
Hourly RSI (Relative Strength Index) – The RSI for XRP/USD is now above the 50 level.
Major Support Levels – $1.3620 and $1.3450.
Major Resistance Levels – $1.3850 and $1.3940.
Why this matters
XRP is a tracked market entity in the DigitalMoneyBox archive, making this useful context for readers monitoring repeated mentions and follow-up coverage.
Original source
Read on NewsBTCRelated market context

Ethereum (ETH) Price Prediction: $2,000 or $1,680 Next as ETH Reaches a Critical Turning Point
Ethereum price has fallen back below $1,900 after buyers failed to maintain the latest recovery, leaving ETH positioned between an...
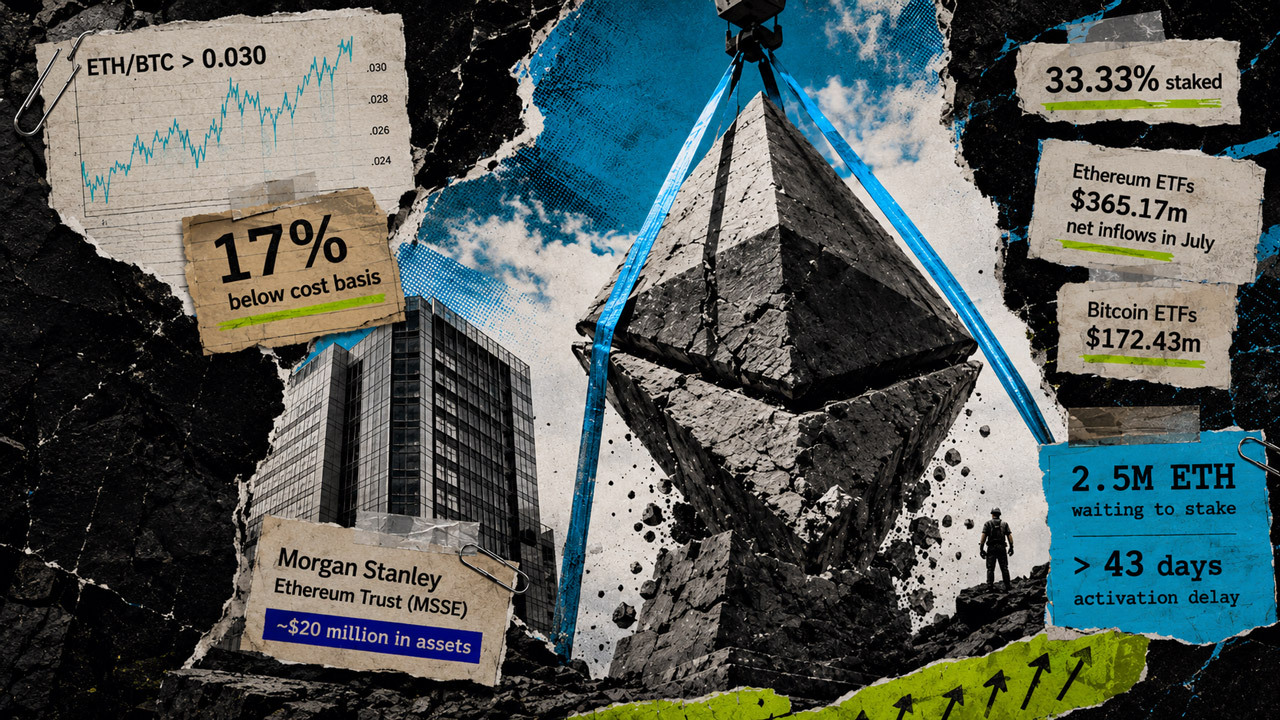
Ethereum just outpaced Bitcoin with $365 million in ETF inflows, but on-chain data shows the real bottom isn’t in yet
Ethereum outpaced Bitcoin in July as stronger investment-product demand and corporate accumulation powered its first sustained rel...

Bitcoin (BTC) Price Today: Michael Saylor’s Strategy Reports $8.3B Loss as BTC Slides Below $64K
The BTC move comes shortly after Strategy reported an $8.33 billion operating loss for the second quarter of 2026, including an $8...

Sam Altman ChatGPT AI Predicts a Historic XRP Price Move Before End of 2026
ChatGPT AI predicts a multi-year breakout for XRP, with the price prediction extending all the way to the end of 2027. From today’...

Bitcoin And Ethereum Edge Higher As Traders Watch Altcoin Rotation
Bitcoin and Ethereum edged higher into July 31, while a small shift in market dominance suggested traders were again watching whet...

Bitcoin ETFs just bled $265M in a brutal 24 hours, and Ethereum’s supposed rescue is another BlackRock illusion
U.S. spot Bitcoin funds posted net outflows of $265.4 million on July 31, reversing a $233.1 million inflow the previous session....