XRP Price Rebound in Jeopardy: Recovery May Falter
XRP price declined heavily from the $0.5250 resistance zone. It tested the $0.4540 support zone and is now attempting to recover above $0.4880. XRP is correcting losses above the $0.4820 and $0.4840 levels. The price is...

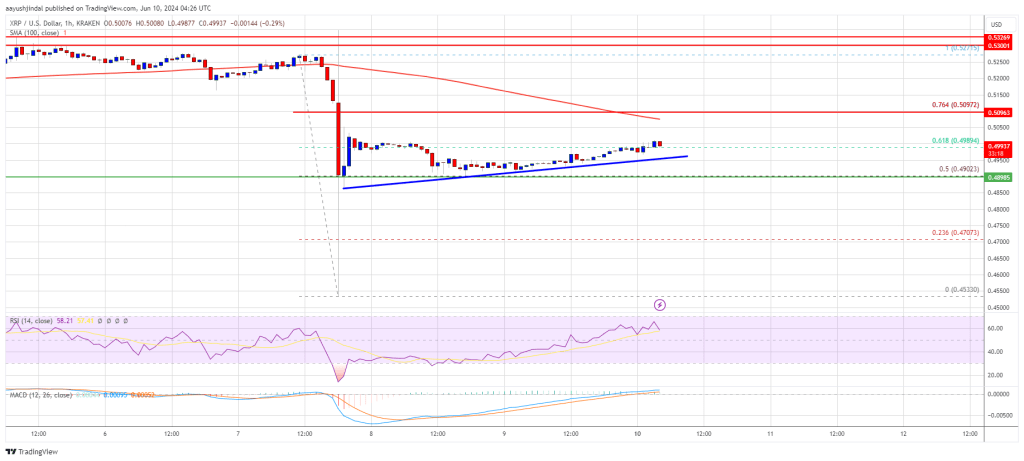
XRP price declined heavily from the $0.5250 resistance zone. It tested the $0.4540 support zone and is now attempting to recover above $0.4880.
- XRP is correcting losses above the $0.4820 and $0.4840 levels.
- The price is now trading below $0.5050 and the 100-hourly Simple Moving Average.
- There is a connecting bullish trend line forming with support at $0.4950 on the hourly chart of the XRP/USD pair (data source from Kraken).
- The pair could dip again if it stays below the $0.5050 resistance zone.
XRP price started a major decline like Ethereum and declined below the $0.50 support. The price even spiked below the $0.4650 support zone. A low was formed at $0.4533 and the price is now correcting losses.
There was a move above the $0.470 and $0.4750 resistance levels. The price climbed above the 50% Fib retracement level of the downward move from the $0.5271 swing high to the $0.4533 low. There is also a connecting bullish trend line forming with support at $0.4950 on the hourly chart of the XRP/USD pair.
The pair is slowly moving above the 61.8% Fib retracement level of the downward move from the $0.5271 swing high to the $0.4533 low. However, it is still trading below $0.5050 and the 100-hourly Simple Moving Average.
On the upside, the price is facing resistance near the $0.500 level. The first key resistance is near $0.5050. The next major resistance is near the $0.5120 level. A close above the $0.5120 resistance zone could send the price higher. The next key resistance is near $0.5250.
If there is a close above the $0.5250 resistance level, there could be a steady increase toward the $0.5320 resistance. Any more gains might send the price toward the $0.550 resistance.
Another Drop?If XRP fails to clear the $0.5050 resistance zone, it could start another decline. Initial support on the downside is near the $0.4950 level and the trend line.
The next major support is at $0.4900. If there is a downside break and a close below the $0.490 level, the price might accelerate lower. In the stated case, the price could decline and retest the $0.4740 support in the near term.
Technical Indicators
Hourly MACD – The MACD for XRP/USD is now losing pace in the bearish zone.
Hourly RSI (Relative Strength Index) – The RSI for XRP/USD is now above the 50 level.
Major Support Levels – $0.4950 and $0.4900.
Major Resistance Levels – $0.500 and $0.5050.
Original source
Read on NewsBTCRelated market context

Uranium Holds Above $85 as Mining ETF Rebounds From June Sell-Off
The latest charts display that the market is divided into stable physical prices and uranium shares trying to regain momentum afte...

Bitcoin price challenges $64,000 weekend wall – needing a breakout or risk a deeper correction
Bitcoin reclaimed $64,000 on June 12 and touched an intraday high of $64,301 in the same session that spot ETF flows finally flipp...

Standard Chartered Says Bitcoin Bottomed Near $59,000 As Crypto Winter Ends
TL;DR Standard Chartered’s Geoffrey Kendrick reportedly says Bitcoin’s $59,000 area marked the cycle bottom. The note cites SpaceX...

Bitcoin Mining Cost Model Points To $47,000 Floor, But Analysts Urge Caution
TL;DR Crypto Rover says Bitcoin has never bottomed below electrical production cost, currently estimated at $47,000. Mining-cost m...

Bitcoin rises above $64,000 after Pakistan prime minister says Iran peace deal is near
Bitcoin traded above $64,000 on Saturday, supported by its strongest ETF inflows in a month and growing optimism around geopolitic...

US forces shoot down Iranian attack drones near Strait of Hormuz, Bitcoin drops below $73K
Geopolitical tensions near vital oil routes can destabilize financial markets, highlighting the interconnectedness of global secur...