XRP Price Reclaims Key Resistance — Are More Gains on the Horizon?
XRP price started a fresh increase from the $1.920 zone. The price is back above $2.10 and might struggle to continue higher above the $2.20 zone. XRP price started a fresh increase above the $2.050 zone. The price is no...
Archive context
Older archive item. Useful for background and entity history, but not a fresh market-moving signal.

XRP price started a fresh increase from the $1.920 zone. The price is back above $2.10 and might struggle to continue higher above the $2.20 zone.
- XRP price started a fresh increase above the $2.050 zone.
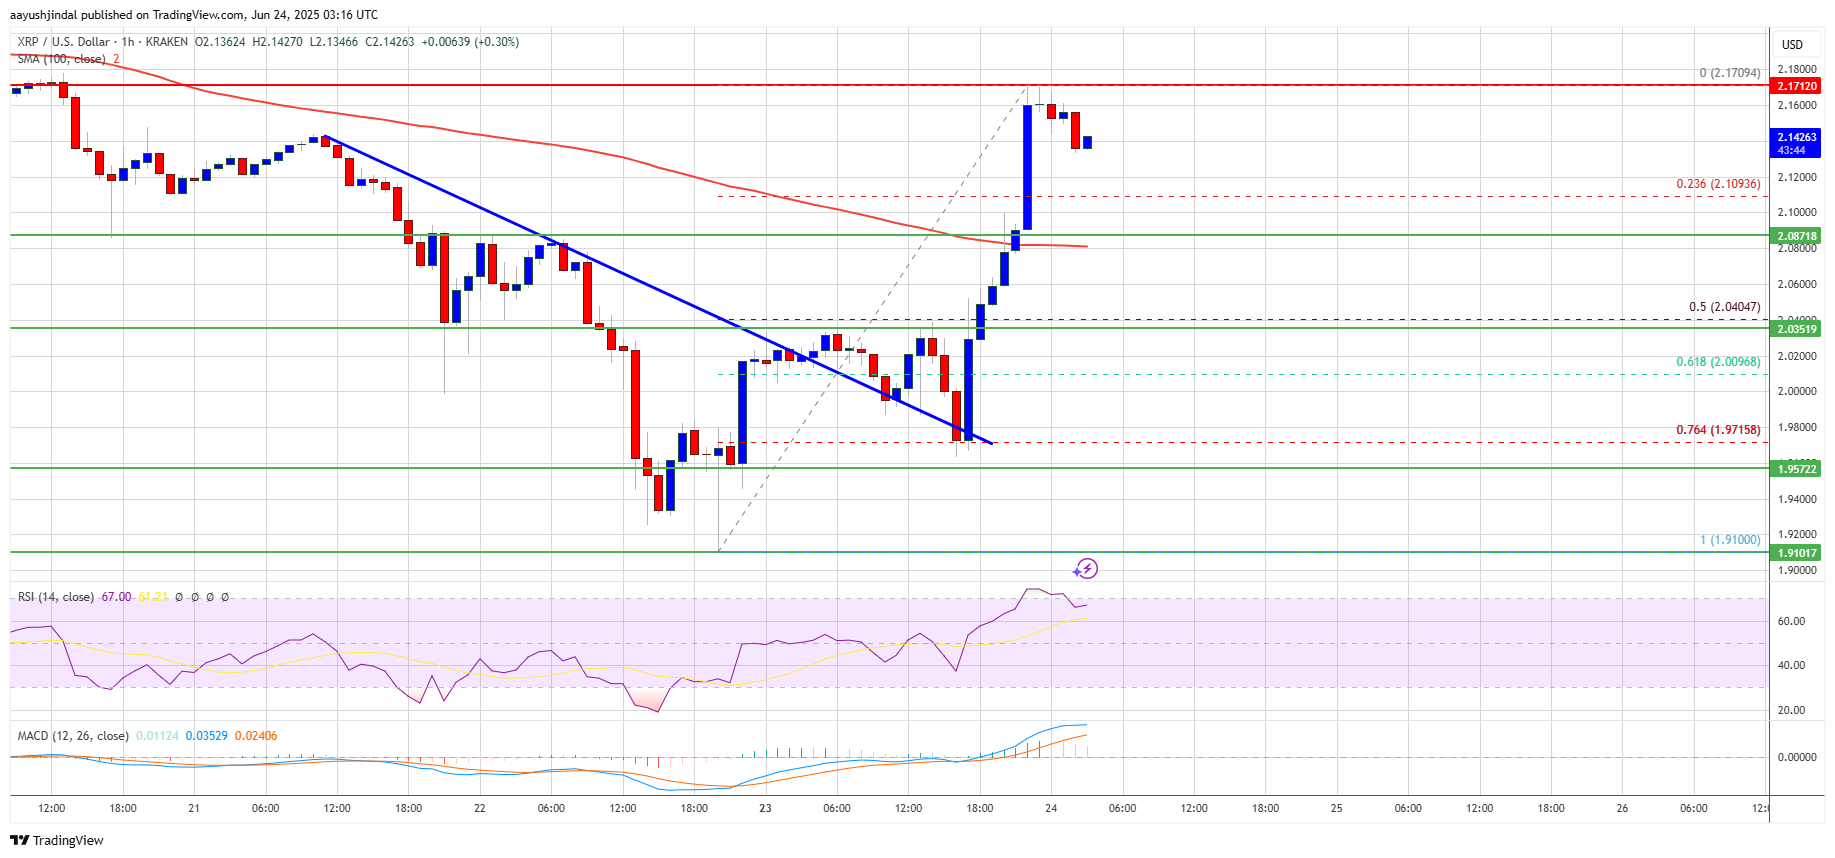
- The price is now trading above $2.10 and the 100-hourly Simple Moving Average.
- There was a break above a key bearish trend line with resistance at $2.00 on the hourly chart of the XRP/USD pair (data source from Kraken).
- The pair might start a fresh increase if there is a close above the $2.180 resistance zone.
XRP price remained supported above the $1.920 zone and started a fresh increase, like Bitcoin and Ethereum. The price recovered above the $2.00 and $2.020 resistance levels.
Besides, there was a break above a key bearish trend line with resistance at $2.00 on the hourly chart of the XRP/USD pair. The pair even cleared the $2.10 resistance and $2.150 hurdle. However, the bears were active below $2.20.
A high was formed at $2.170 and the price is now consolidating above the 23.6% Fib retracement level of the upward move from the $1.910 swing low to the $2.170 high.
The price is now trading above $2.10 and the 100-hourly Simple Moving Average. On the upside, the price might face resistance near the $2.1650 level. The first major resistance is near the $2.180 level. The next resistance is $2.20. A clear move above the $2.20 resistance might send the price toward the $2.250 resistance.
Any more gains might send the price toward the $2.300 resistance or even $2.320 in the near term. The next major hurdle for the bulls might be $2.50.
Another Drop?If XRP fails to clear the $2.180 resistance zone, it could start another decline. Initial support on the downside is near the $2.0880 level. The next major support is near the $2.050 level or the 50% Fib retracement level of the upward move from the $1.910 swing low to the $2.170 high.
If there is a downside break and a close below the $2.050 level, the price might continue to decline toward the $2.00 support. The next major support sits near the $1.920 zone.
Technical Indicators
Hourly MACD – The MACD for XRP/USD is now losing pace in the bullish zone.
Hourly RSI (Relative Strength Index) – The RSI for XRP/USD is now above the 50 level.
Major Support Levels – $2.050 and $2.00.
Major Resistance Levels – $2.180 and $2.20.
Why this matters
This altcoin story adds another data point to the current market tape and is useful when read alongside nearby source coverage.
Original source
Read on NewsBTCRelated market context

Bitcoin (BTC) Price Prediction: BTC Holds $63K Support—Can Rising Active Addresses Offset Bearish Technical Signals?
Although the BTC price has remained near a key support zone, recent chart signals and Strategy’s sale of a portion of its Bitcoin...

Vitalik Buterin Says Ethereum’s Next Major Upgrade Will Take Three to Four Years and Rival the Merge
Ethereum co-founder Vitalik Buterin says the network’s next major overhaul, an initiative researchers are calling “Lean Ethereum,”...

Bitcoin Price Prediction: Peter Brandt Might Dump BTC for Gold
Bitcoin is facing a test, and its price prediction is not helping. So far in 2026, BTC has fallen about 28%, while gold is down ju...

Bitcoin needs trillions to go parabolic again as ETF demand fades
Bitcoin’s next major rally may depend less on whether investors still believe in the asset than on whether enough large balance sh...

SEC Closes Consensys Ethereum 2.0 Probe, Removing A Major Staking Overhang
Ethereum has one less regulatory cloud hanging over it after Consensys said the U.S. Securities and Exchange Commission has closed...

‘Privacy Is No Longer an Afterthought’: Vitalik Buterin Unveils 3-4 Year Plan to Rebuild Ethereum
Ethereum co-founder Vitalik Buterin has published a “Lean Ethereum” roadmap that would replace nearly every major component of the...