XRP Price Recovers Past 100 SMA: Bullish Indicators Ahead?
XRP price started a decent recovery wave above $0.4850. The price reclaimed the 100-hourly SMA and might aim for more upsides. XRP price found support at $0.4600 and started a recovery wave. The price is now trading abov...

XRP price started a decent recovery wave above $0.4850. The price reclaimed the 100-hourly SMA and might aim for more upsides.
- XRP price found support at $0.4600 and started a recovery wave.
- The price is now trading above $0.4850 and the 100-hourly Simple Moving Average.
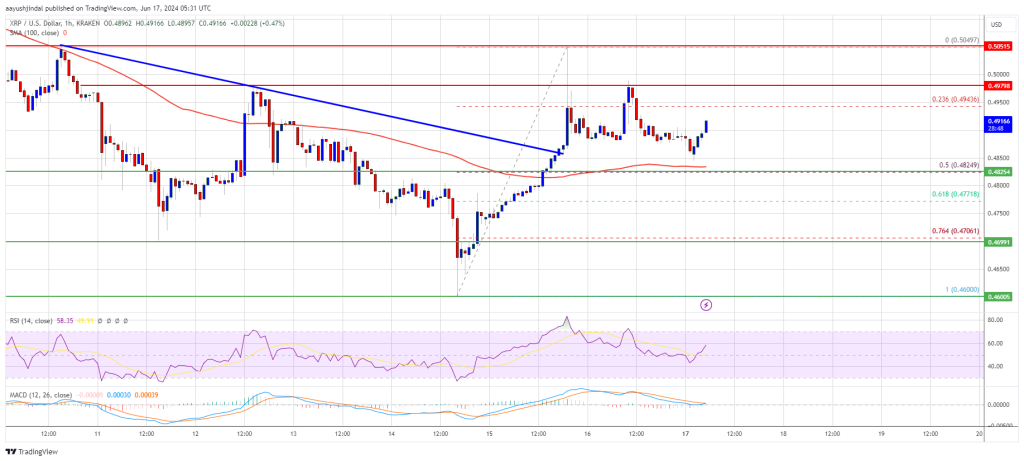
- There was a break above a key bearish trend line with resistance at $0.4860 on the hourly chart of the XRP/USD pair (data source from Kraken).
- The pair could continue to rise unless it fails to stay above the $0.4820 support zone.
XRP price extended losses below the $0.4650 level like Bitcoin. However, the bulls took a stand near $0.4600, and the price recently started a decent recovery wave like Ethereum.
There was a move above the $0.4680 and $0.4720 resistance levels. Besides, there was a break above a key bearish trend line with resistance at $0.4860 on the hourly chart of the XRP/USD pair. The pair even spiked above the $0.5000 zone.
A high was formed at $0.5049 and the price is now correcting gains. There was a move below the $0.4950 support zone. There was a drop below the 23.6% Fib retracement level of the upward move from the $0.4600 swing low to the 0.5049 high.
The price is now trading above $0.4850 and the 100-hourly Simple Moving Average. On the upside, the price is facing resistance near the $0.4950 level. The first key resistance is near $0.4980.
The next major resistance is near the $0.5050 level. A close above the $0.5050 resistance zone could send the price higher. The next key resistance is near $0.5250. If there is a close above the $0.5250 resistance level, there could be a steady increase toward the $0.5320 resistance. Any more gains might send the price toward the $0.5500 resistance.
Another Decline?If XRP fails to clear the $0.4980 resistance zone, it could continue to move down. Initial support on the downside is near the $0.4850 level and the 100-hourly Simple Moving Average.
The next major support is at $0.4720. If there is a downside break and a close below the $0.4720 level, the price might gain bearish momentum. In the stated case, the price could decline and retest the $0.460 support in the near term.
Technical Indicators
Hourly MACD – The MACD for XRP/USD is now gaining pace in the bullish zone.
Hourly RSI (Relative Strength Index) – The RSI for XRP/USD is now above the 50 level.
Major Support Levels – $0.4850 and $0.4720.
Major Resistance Levels – $0.4980 and $0.5050.
Original source
Read on NewsBTCRelated market context

Uranium Holds Above $85 as Mining ETF Rebounds From June Sell-Off
The latest charts display that the market is divided into stable physical prices and uranium shares trying to regain momentum afte...

Standard Chartered Says Bitcoin Bottomed Near $59,000 As Crypto Winter Ends
TL;DR Standard Chartered’s Geoffrey Kendrick reportedly says Bitcoin’s $59,000 area marked the cycle bottom. The note cites SpaceX...

Bitcoin price challenges $64,000 weekend wall – needing a breakout or risk a deeper correction
Bitcoin reclaimed $64,000 on June 12 and touched an intraday high of $64,301 in the same session that spot ETF flows finally flipp...

Tether USDT Briefly Overtakes Ethereum in Market Cap: A $187B Wake-Up Call
For a few hours, earlier this week, Tether USDT stablecoin held a higher market cap than Ethereum, the first time that has happene...

Bitcoin rises above $64,000 after Pakistan prime minister says Iran peace deal is near
Bitcoin traded above $64,000 on Saturday, supported by its strongest ETF inflows in a month and growing optimism around geopolitic...

Are 24/7 CME Bitcoin futures a volatility cure — or a new leverage trap?
Wall Street got to trade Bitcoin around the clock just in time to watch the market fall apart. CME Group launched 24/7 trading for...