XRP Price Recovers Slightly, Showing Subtle Signs of Bullish Reaccumulation
XRP price started a fresh decline below $2.00. The price is now recovering from $1.820 and might face hurdles near the $2.150 pivot level. XRP price started a recovery wave from the $1.820 zone. The price is now trading...

XRP price started a fresh decline below $2.00. The price is now recovering from $1.820 and might face hurdles near the $2.150 pivot level.
- XRP price started a recovery wave from the $1.820 zone.
- The price is now trading above $2.00 and the 100-hourly Simple Moving Average.
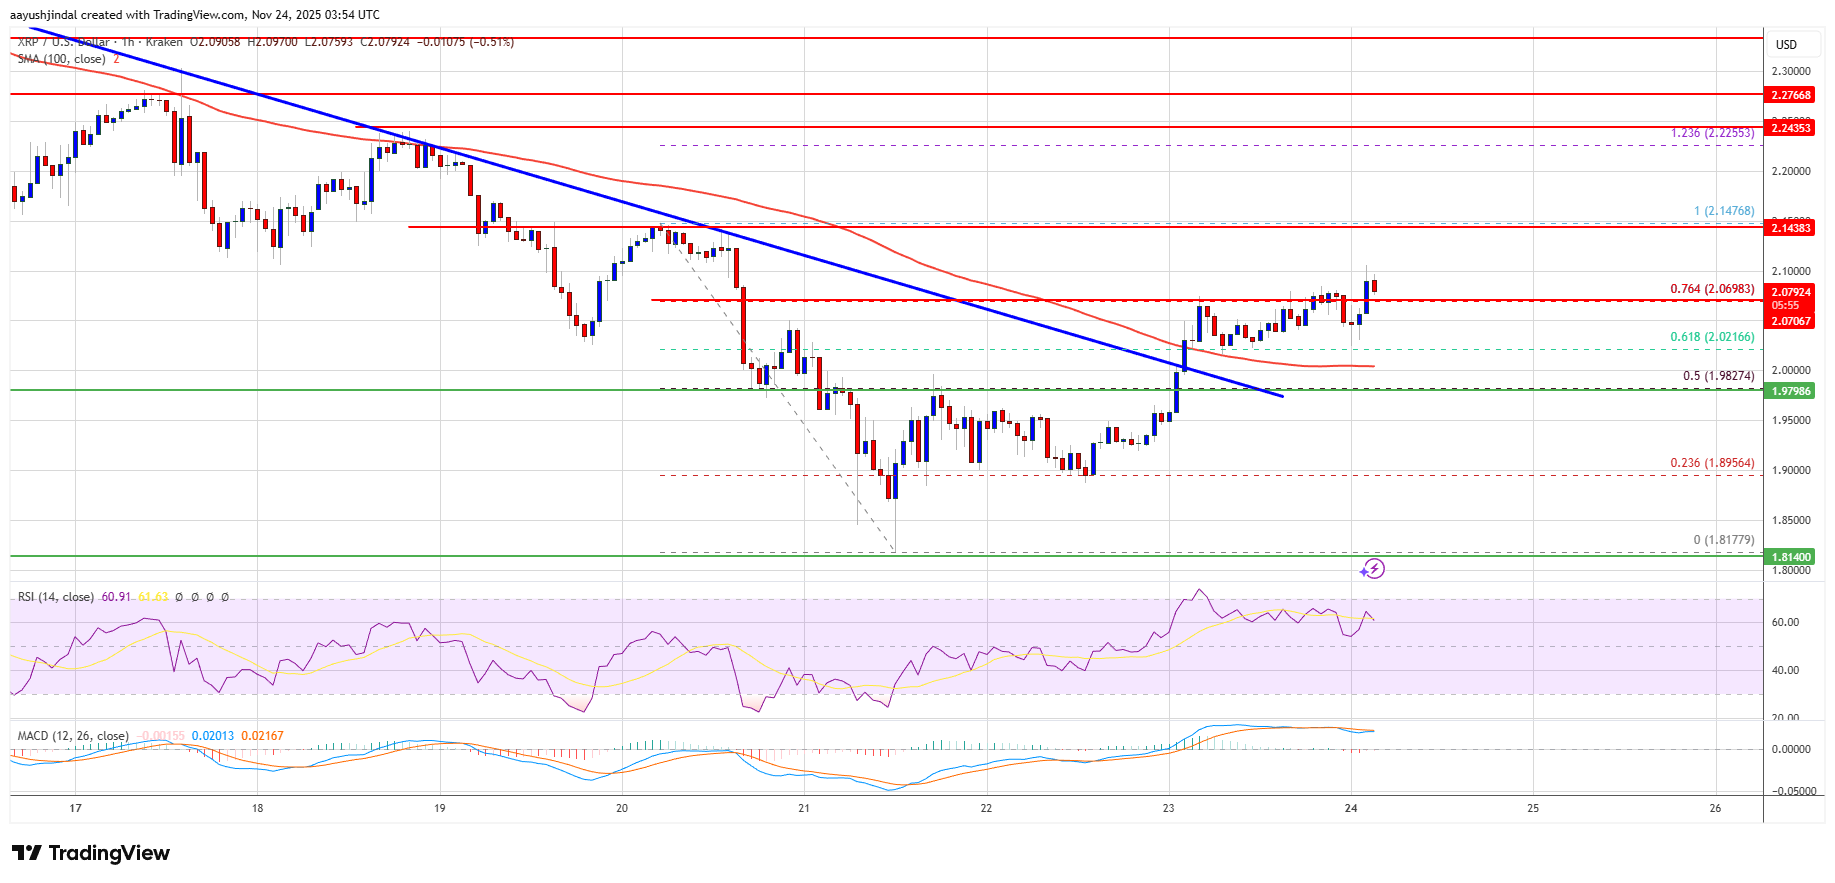
- There was a break above a key bearish trend line with resistance at $2.00 on the hourly chart of the XRP/USD pair (data source from Kraken).
- The pair could continue to move up if it settles above $2.150.
XRP price extended losses below the $2.00 support, like Bitcoin and Ethereum. The price even spiked below $1.90 before the bulls appeared. A low was formed at $1.8177, and the price is now attempting to recover.
There was a move above the $1.88 and $1.95 levels. The bulls were able to push the price above the 50% Fib retracement level of the downward move from the $2.140 swing high to the $1.817 low. Besides, there was a break above a key bearish trend line with resistance at $2.00 on the hourly chart of the XRP/USD pair.
The price is now trading above $2.00 and the 100-hourly Simple Moving Average. It is also above the 76.4% Fib retracement level of the downward move from the $2.140 swing high to the $1.817 low.
If there is a fresh upward move, the price might face resistance near the $2.120 level. The first major resistance is near the $2.150 level. A close above $2.150 could send the price to $2.20. The next hurdle sits at $2.250. A clear move above the $2.250 resistance might send the price toward the $2.320 resistance. Any more gains might send the price toward the $2.350 resistance. The next major hurdle for the bulls might be near $2.40.
Another Decline?If XRP fails to clear the $2.150 resistance zone, it could start a fresh decline. Initial support on the downside is near the $2.00 level. The next major support is near the $1.980 level.
If there is a downside break and a close below the $1.980 level, the price might continue to decline toward $1.880. The next major support sits near the $1.8450 zone, below which the price could continue lower toward $1.80.
Technical Indicators
Hourly MACD – The MACD for XRP/USD is now gaining pace in the bullish zone.
Hourly RSI (Relative Strength Index) – The RSI for XRP/USD is now above the 50 level.
Major Support Levels – $1.980 and $1.880.
Major Resistance Levels – $2.150 and $2.250.
Original source
Read on NewsBTCRelated market context

Ethereum Nears 200 Million Non-Empty Wallets Despite Market Uncertainty
Despite persistent market uncertainty and bearish sentiment across parts of the cryptocurrency sector, Ethereum is approaching a s...

Bitcoin (BTC) Price Prediction: BTC Eyes $70K Liquidity Sweep as Whales Reclaim Control Near $62K
Market data suggests that long-term holders remain largely inactive, while whale activity is beginning to recover, creating an int...

Ethereum Futures Just Hit A Binance Record: Are Traders Calling The Bottom?
Ethereum derivatives activity is flashing a fresh signal on Binance, where open interest measured in ETH terms has reached a new a...

Ethereum Price Prediction: 3 Million ETH Rushes Into Staking as Sellers Vanish
Is nobody leaving Ethereum? A record 36 million ETH is now locked in staking, roughly 29–30% of the circulating supply, and the va...

The 3-Part Impulse That Shows Where The XRP Price Is Headed Next
XRP bulls are trying to turn a brutal selloff into something bigger than a relief bounce. An interesting setup shows a possible th...

Most Traders Will Scroll Past This Grok AI Bitcoin Predicts, Big Mistake
Elon Musk Grok AI just looked at a Bitcoin chart down more than 50% and predicts it’s a classic accumulation zone, targeting $150,...