XRP Price Recovery Attempt Sparks Question: Is Momentum Turning?
XRP price started a steady increase above $1.90. The price is now struggling to clear $1.950 and might start a fresh decline below $1.90. XRP price started a fresh increase above the $1.90 zone. The price is now trading...

XRP price started a steady increase above $1.90. The price is now struggling to clear $1.950 and might start a fresh decline below $1.90.
- XRP price started a fresh increase above the $1.90 zone.
- The price is now trading above $1.910 and the 100-hourly Simple Moving Average.
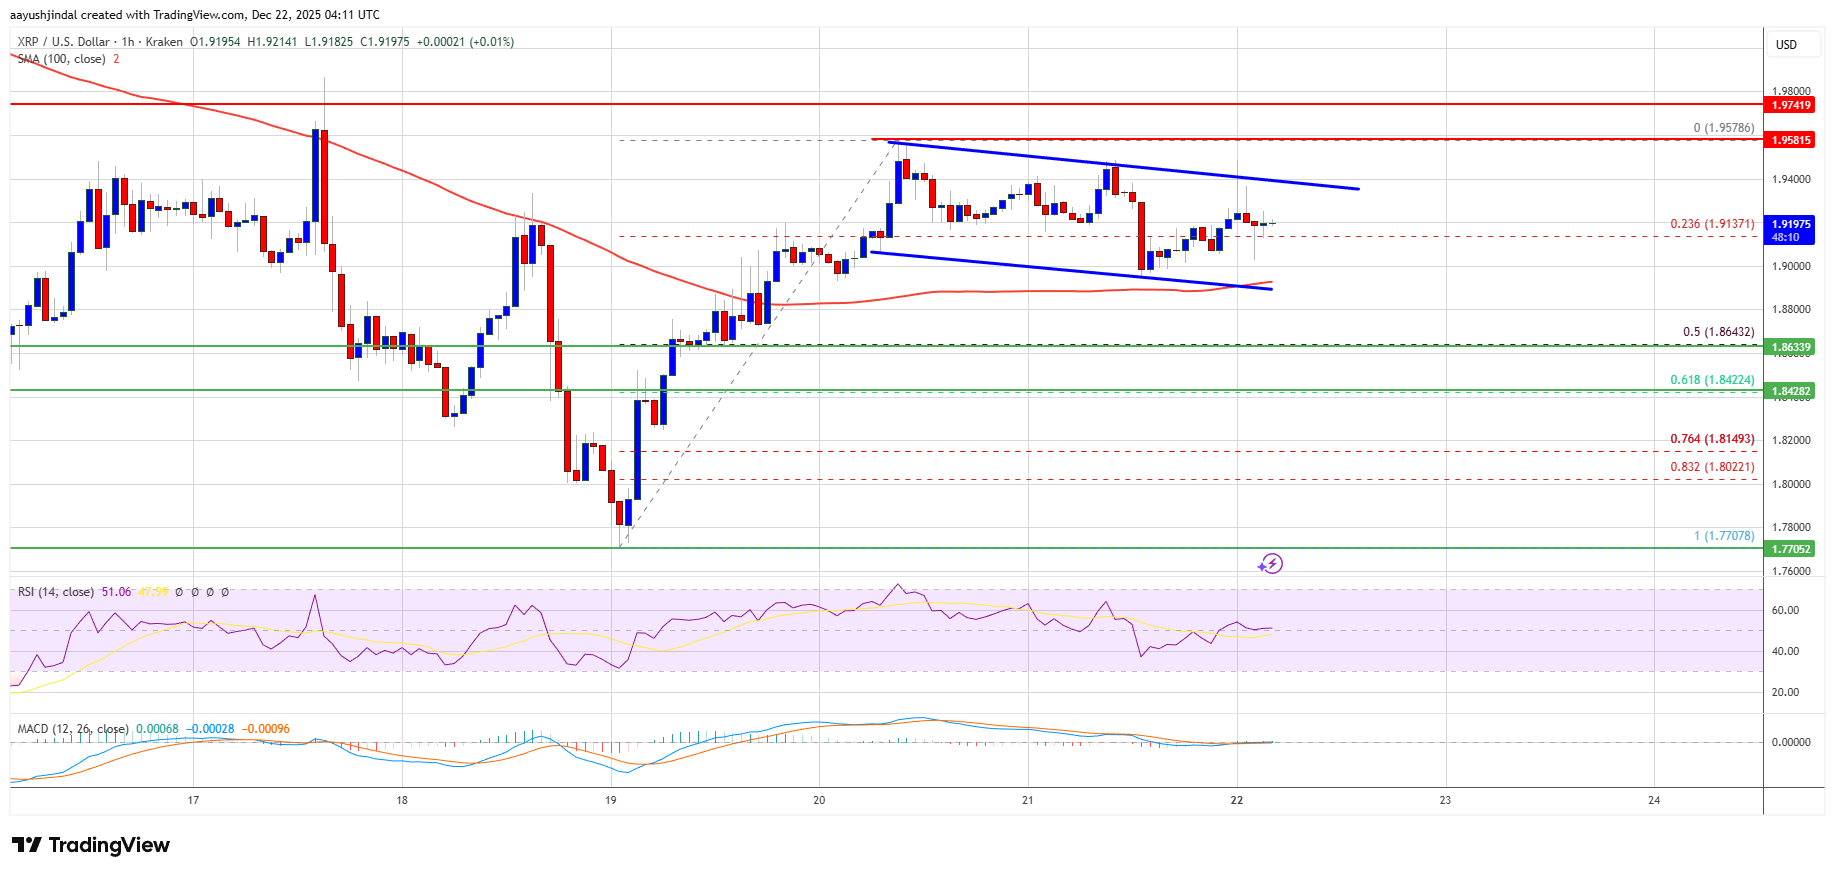
- There is a declining channel or a flag pattern forming with resistance at $1.940 on the hourly chart of the XRP/USD pair (data source from Kraken).
- The pair could continue to move up if it settles above 1.950.
XRP price started a decent upward move above $1.880 and $1.90, like Bitcoin and Ethereum. The price gained pace for a clear move above the $1.920 resistance.
The bulls even pumped the price above the $1.9420 zone. A high was formed at $1.9578 and the price started a downside correction. There was a move below the 23.6% Fib retracement level of the upward move from the $1.770 swing low to the $1.9578 high.
The price is now trading above $1.90 and the 100-hourly Simple Moving Average. Besides, there is a declining channel or a flag pattern forming with resistance at $1.940 on the hourly chart of the XRP/USD pair.
If there is a fresh upward move, the price might face resistance near the $1.940 level. The first major resistance is near the $1.9550 level, above which the price could rise and test $2.00. A clear move above the $2.00 resistance might send the price toward the $2.050 resistance. Any more gains might send the price toward the $2.120 resistance. The next major hurdle for the bulls might be near $2.150.
Downside Continuation?If XRP fails to clear the $1.9550 resistance zone, it could start a fresh decline. Initial support on the downside is near the $1.90 level. The next major support is near the $1.8650 level or the 50% Fib retracement level of the upward move from the $1.770 swing low to the $1.9578 high.
If there is a downside break and a close below the $1.8650 level, the price might continue to decline toward $1.8420. The next major support sits near the $1.80 zone, below which the price could continue lower toward $1.7750.
Technical Indicators
Hourly MACD – The MACD for XRP/USD is now losing pace in the bullish zone.
Hourly RSI (Relative Strength Index) – The RSI for XRP/USD is now near the 50 level.
Major Support Levels – $1.90 and $1.8650.
Major Resistance Levels – $1.9550 and $2.00.
Original source
Read on NewsBTCRelated market context

Ethereum Nears 200 Million Non-Empty Wallets Despite Market Uncertainty
Despite persistent market uncertainty and bearish sentiment across parts of the cryptocurrency sector, Ethereum is approaching a s...

Bitcoin (BTC) Price Prediction: BTC Eyes $70K Liquidity Sweep as Whales Reclaim Control Near $62K
Market data suggests that long-term holders remain largely inactive, while whale activity is beginning to recover, creating an int...

XRP Price Prediction: Japan XRP ETF Listing is Getting Closer
Japan just handed XRP bulls a major regulatory tailwind. XRP price is retesting a congestion zone, and the prediction could turn b...

Ethereum Price Prediction: 3 Million ETH Rushes Into Staking as Sellers Vanish
Is nobody leaving Ethereum? A record 36 million ETH is now locked in staking, roughly 29–30% of the circulating supply, and the va...

Ethereum Futures Just Hit A Binance Record: Are Traders Calling The Bottom?
Ethereum derivatives activity is flashing a fresh signal on Binance, where open interest measured in ETH terms has reached a new a...

Most Traders Will Scroll Past This Grok AI Bitcoin Predicts, Big Mistake
Elon Musk Grok AI just looked at a Bitcoin chart down more than 50% and predicts it’s a classic accumulation zone, targeting $150,...