XRP Price Recovery Looks Fragile—Can Bulls Break the Cap?
XRP price started a recovery wave above $1.90. The price is now consolidating and might struggle to clear the $2.00 resistance. XRP price started a recovery wave above the $1.9050 zone. The price is now trading below $2....

XRP price started a recovery wave above $1.90. The price is now consolidating and might struggle to clear the $2.00 resistance.
- XRP price started a recovery wave above the $1.9050 zone.
- The price is now trading below $2.00 and the 100-hourly Simple Moving Average.
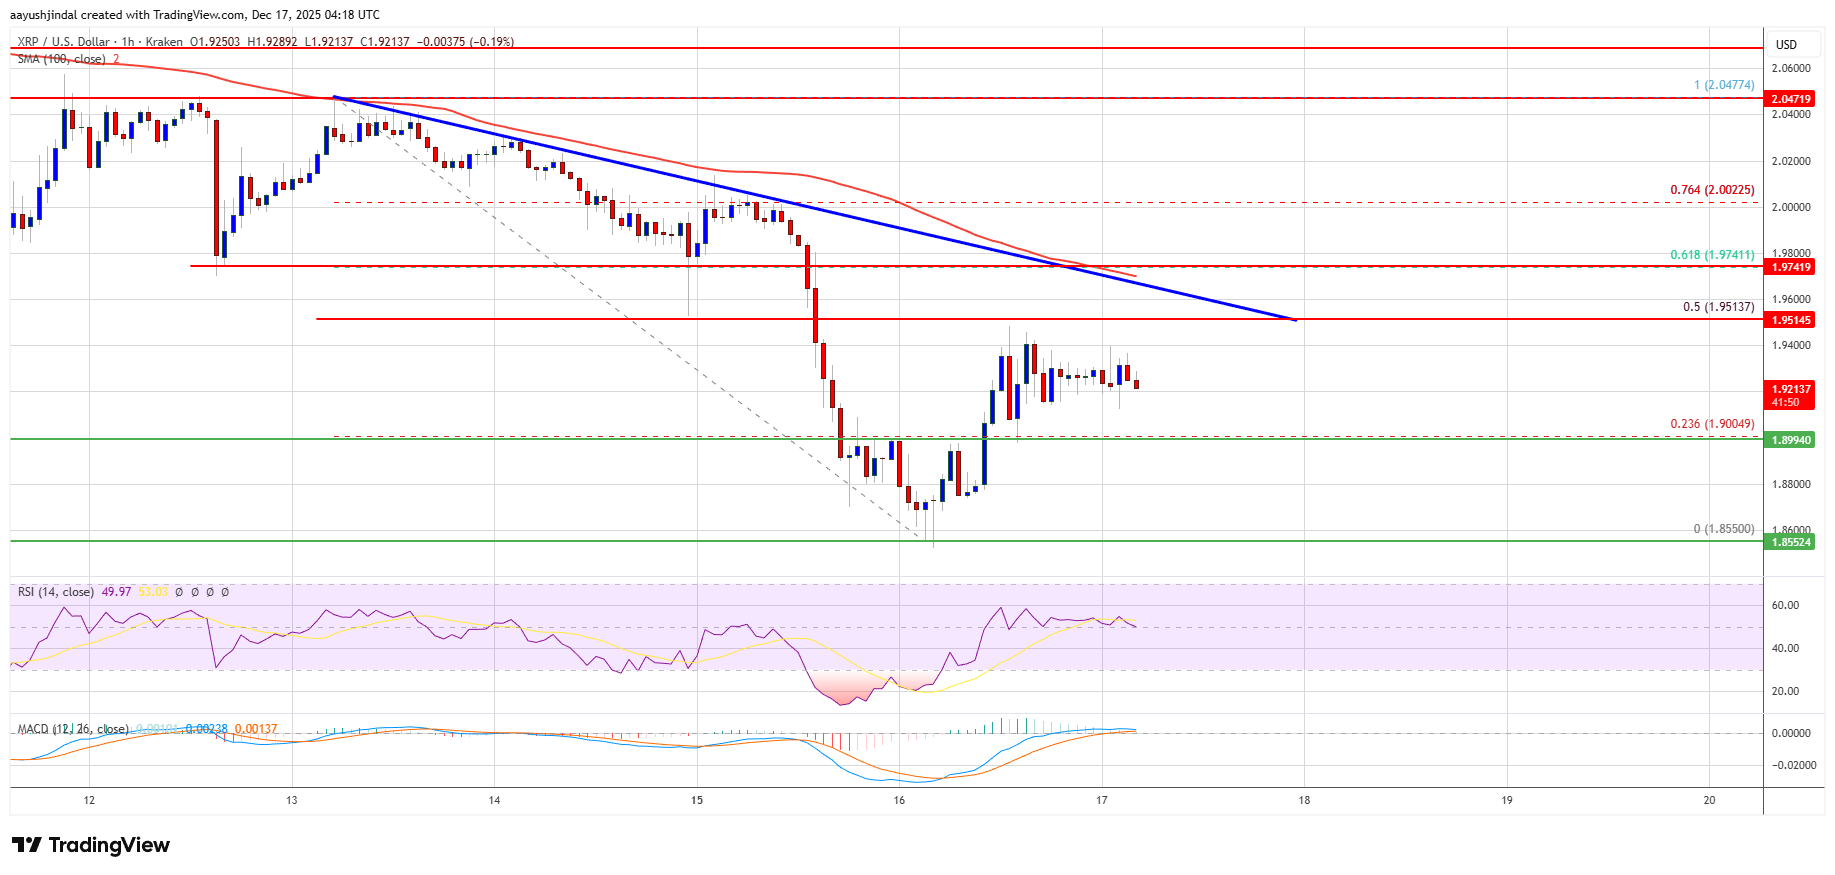
- There is a bearish trend line forming with resistance at $1.9520 on the hourly chart of the XRP/USD pair (data source from Kraken).
- The pair could continue to move up if it settles above $2.00.
XRP price remained supported above $1.850 and started a recovery wave, like Bitcoin and Ethereum. The price was able to climb above $1.880 and $1.90 to enter a short-term positive zone.
There was also a move above the 23.6% Fib retracement level of the downward move from the $2.047 swing high to the $1.850 low. The bears defended a close above the $1.950 level and the price reacted to the downside. There is also a bearish trend line forming with resistance at $1.9520 on the hourly chart of the XRP/USD pair.
The price is now trading below $1.950 and the 100-hourly Simple Moving Average. If there is a fresh upward move, the price might face resistance near the $1.950 level and the trend line. It coincides with the 50% Fib retracement level of the downward move from the $2.047 swing high to the $1.850 low.
The first major resistance is near the $2.00 level. A close above $2.00 could send the price to $2.050. The next hurdle sits at $2.120. A clear move above the $2.120 resistance might send the price toward the $2.20 resistance. Any more gains might send the price toward the $2.220 resistance. The next major hurdle for the bulls might be near $2.250.
Another Drop?If XRP fails to clear the $2.00 resistance zone, it could start a fresh decline. Initial support on the downside is near the $1.90 level. The next major support is near the $1.850 level.
If there is a downside break and a close below the $1.850 level, the price might continue to decline toward $1.820. The next major support sits near the $1.80 zone, below which the price could continue lower toward $1.7650.
Technical Indicators
Hourly MACD – The MACD for XRP/USD is now losing pace in the bearish zone.
Hourly RSI (Relative Strength Index) – The RSI for XRP/USD is now above the 50 level.
Major Support Levels – $1.90 and $1.850.
Major Resistance Levels – $1.950 and $2.00.
Original source
Read on NewsBTCRelated market context

Ethereum Nears 200 Million Non-Empty Wallets Despite Market Uncertainty
Despite persistent market uncertainty and bearish sentiment across parts of the cryptocurrency sector, Ethereum is approaching a s...

Bitcoin (BTC) Price Prediction: BTC Eyes $70K Liquidity Sweep as Whales Reclaim Control Near $62K
Market data suggests that long-term holders remain largely inactive, while whale activity is beginning to recover, creating an int...

Most Traders Will Scroll Past This Grok AI Bitcoin Predicts, Big Mistake
Elon Musk Grok AI just looked at a Bitcoin chart down more than 50% and predicts it’s a classic accumulation zone, targeting $150,...

Ethereum Price Prediction: 3 Million ETH Rushes Into Staking as Sellers Vanish
Is nobody leaving Ethereum? A record 36 million ETH is now locked in staking, roughly 29–30% of the circulating supply, and the va...

The 3-Part Impulse That Shows Where The XRP Price Is Headed Next
XRP bulls are trying to turn a brutal selloff into something bigger than a relief bounce. An interesting setup shows a possible th...

XRP Price Prediction: Japan Regulates Crypto like Stocks, XRP to Benefit First
Japan just rewrote the rules. XRP price is battling below resistance at $1.10, but it’s prediction is getting bullish as Japan’s p...