XRP Price Retreats From Highs — Is The Rally In Jeopardy?
XRP price started a fresh decline from the $2.320 zone. The price is now correcting gains and might find bids near the $2.120 zone. XRP price started a fresh decline from the $2.320 zone. The price is now trading below $...
Archive context
Older archive item. Useful for background and entity history, but not a fresh market-moving signal.

XRP price started a fresh decline from the $2.320 zone. The price is now correcting gains and might find bids near the $2.120 zone.
- XRP price started a fresh decline from the $2.320 zone.
- The price is now trading below $2.220 and the 100-hourly Simple Moving Average.
- There was a break below a key bullish trend line with support at $2.20 on the hourly chart of the XRP/USD pair (data source from Kraken).
- The pair could extend losses if it fails to clear the $2.220 resistance zone.
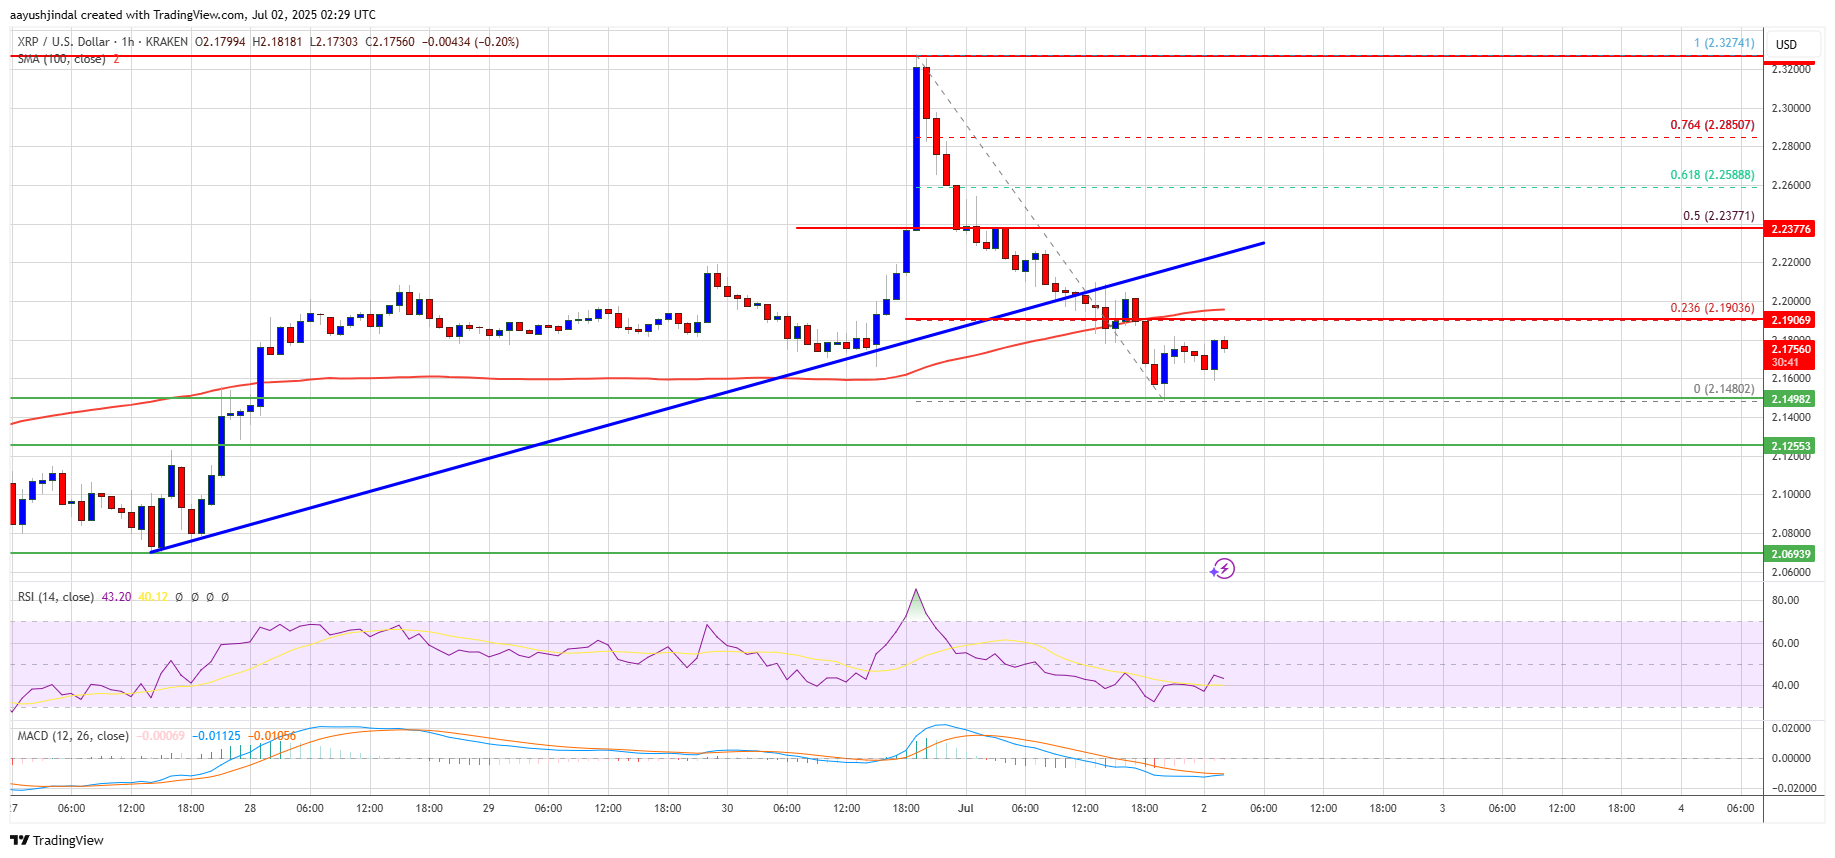
XRP price failed to extend gains above the $2.320 resistance and started a fresh decline, like Bitcoin and Ethereum. The price declined below the $2.250 and $2.220 support levels.
Besides, there was a break below a key bullish trend line with support at $2.20 on the hourly chart of the XRP/USD pair. The pair even spiked below the $2.150 level. A low was formed at $2.148 and the price is now consolidating losses below the 23.6% Fib retracement level of the downward move from the $2.327 swing high to the $2.148 low.
The price is now trading below $2.220 and the 100-hourly Simple Moving Average. On the upside, the price might face resistance near the $2.20 level. The first major resistance is near the $2.220 level. The next resistance is $2.2380. It is close to the 50% Fib retracement level of the downward move from the $2.327 swing high to the $2.148 low.
A clear move above the $2.2380 resistance might send the price toward the $2.2850 resistance. Any more gains might send the price toward the $2.30 resistance or even $2.320 in the near term. The next major hurdle for the bulls might be $2.40.
Fresh Decline?If XRP fails to clear the $2.220 resistance zone, it could start another decline. Initial support on the downside is near the $2.150 level. The next major support is near the $2.120 level.
If there is a downside break and a close below the $2.120 level, the price might continue to decline toward the $2.050 support. The next major support sits near the $2.020 zone.
Technical Indicators
Hourly MACD – The MACD for XRP/USD is now losing pace in the bearish zone.
Hourly RSI (Relative Strength Index) – The RSI for XRP/USD is now below the 50 level.
Major Support Levels – $2.150 and $2.120.
Major Resistance Levels – $2.220 and $2.2850.
Why this matters
This altcoin story adds another data point to the current market tape and is useful when read alongside nearby source coverage.
Original source
Read on NewsBTCRelated market context

Bitcoin (BTC) Price Prediction: BTC Holds $63K Support—Can Rising Active Addresses Offset Bearish Technical Signals?
Although the BTC price has remained near a key support zone, recent chart signals and Strategy’s sale of a portion of its Bitcoin...

Bitcoin Price Prediction: Peter Brandt Might Dump BTC for Gold
Bitcoin is facing a test, and its price prediction is not helping. So far in 2026, BTC has fallen about 28%, while gold is down ju...

Bitcoin miner bottom signal now depends on who survives weak mining profits
A Bitcoin miner-stress signal circulating on X has fallen into a zone analysts associate with severe miner pressure, putting a fam...

XRP Price Prediction: Volume and ETF Inflow Send Ripple Token Higher
XRP price pushed above the $1.14 resistance area after buyers stepped in with heavy volume and bullish prediction. The token climb...
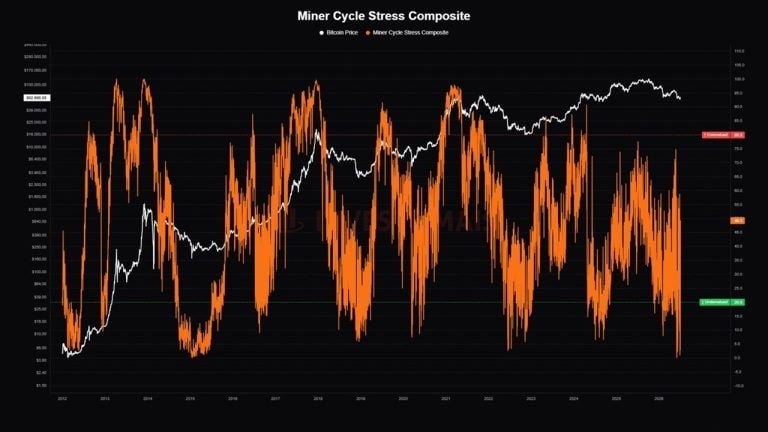
Bitcoin Miner Stress Hits ‘Historically Rare’ Level as 20% of Miners Operate at a Loss
Bitcoin’s Miner Cycle Stress Composite has fallen to a new 2026 low and entered its “undervalued” range, a synchronized decline pr...

Vitalik Buterin Says Ethereum’s Next Major Upgrade Will Take Three to Four Years and Rival the Merge
Ethereum co-founder Vitalik Buterin says the network’s next major overhaul, an initiative researchers are calling “Lean Ethereum,”...