XRP Price Set To Skyrocket 1,100% On This Signal: Crypto Analyst
In crypto trading, history often repeats itself, or at least rhymes. That’s why it can be crucial to spot historically important price signals and patterns. A recent technical analysis by Egrag Crypto has spotlighted suc...
Archive context
Older archive item. Useful for background and entity history, but not a fresh market-moving signal.

In crypto trading, history often repeats itself, or at least rhymes. That’s why it can be crucial to spot historically important price signals and patterns. A recent technical analysis by Egrag Crypto has spotlighted such a pattern for XRP, indicating a possible massive price increase.
This analysis hinges on the observation of a bullish crossover between the 21 Exponential Moving Average (21 EMA) and the 55 Moving Average (55 MA) in the 2-week chart of XRP/USD. Egrag states, “XRP Rockets: 21 EMA & 55 MA Signal Explosion: Let’s decode the XRP trajectory – my focus? Just two pivotal weekly candles after the crossover between 21 EMA & 55MA.”
Will The XRP Price Soar To $7?The chart provided by Egrag Crypto highlights the XRP price movements in the two distinct scenarios when this rare bullish signal occurred. The first bullish crossover of the 21 EMA and 55 MA in the 2-week chart occurred in March 2017 (scenario A). Following this signal, the XRP price saw “two striking 2-week candles. The initial one surged by around 90%, trailed by an electrifying 1100% spike,” Egrag remarked.
For the second time in the history of the XRP price, the signal flashed at the end of December 2020. This time, the XRP rose by 100% in the first candle, succeeded by an 84% surge in the second 2-week candle which marked a collective 200% upswing.
According to the crypto analyst, there’s a high probability that these scenarios will repeat themselves. “Drawing parallels from past bullish runs, my opinion syncs with historical data,” Egrag remarked.
Notably, the chart of Egrag also features an ascending trend line, a bullish indicator, which XRP has tested twice, as shown by the two green circles in mid-2022 and early 2023. These taps on the trend line are critical, as they suggest that each touch is a test of support where the price finds enough buyers to begin a new upward movement.
The analyst speculates that XRP could dip slightly more to tap the ascending trend line a third time, which could be a precursor to a significant price rally. This potential third tap on the trend line is viewed as a buying opportunity that could precede a considerable price surge.
Following this third retest of the trend line, Egrag expects two possible scenarios based on the bullish crossover of the 21 EMA and 55 MA. In scenario A, the crypto analyst envisions a dramatic rise in the XRP price, projecting a target of $7.00, which would represent a staggering increase of 1,139.35% from the current price.
Scenario B suggests a more conservative target of $1.80, which would still be an impressive gain of 218.82%. The “No Return Zone,” marked in red at the $1.80 level, is set just above scenario B’s target. It indicates a critical threshold that could either act as a resistance zone or confirm a strong bullish momentum if the price sustains above it.
Broader Market ForcesThe crypto analyst is also aware that the Bitcoin price traditionally plays a major role for altcoins such as XRP. He therefore notes on the current market conditions, “eyes fixed on BTC as the majority anticipates a $48K-$50K peak, potentially followed by a pullback, igniting a widespread alt season. Yet, what’s intriguing? A scenario where BTC skyrockets to ATH, retraces, and unleashes a truly wild alt season.”
The analyst’s perspective leans towards an initial spike to between $7 to $10, followed by a significant retracement, and then an even more substantial rise to the levels of $20 to $30. On being queried about the extent of the expected retracement from the $7-$10 range, Egrag Crypto answered an “aggressive $1.3-1.5” drawdown.
At press time, XRP traded at $0.61095.
Why this matters
This altcoin story adds another data point to the current market tape and is useful when read alongside nearby source coverage.
Original source
Read on NewsBTCRelated market context

Bitcoin (BTC) Price Prediction: BTC Turns $79K into Support as Risk-On Signal Points to Fresh Rally Toward $100K
The move has also coincided with a shift in Glassnode’s Bitcoin Vector framework. The proprietary model moved into a Risk-On regim...

Hyperliquid (HYPE) Price Prediction: New ATH Near $90 and Whale Accumulation Strengthen $100 Breakout Outlook
Hyperliquid reached roughly $89.60 on September 6, according to exchange market data, while its 24-hour volume remained above $1 b...
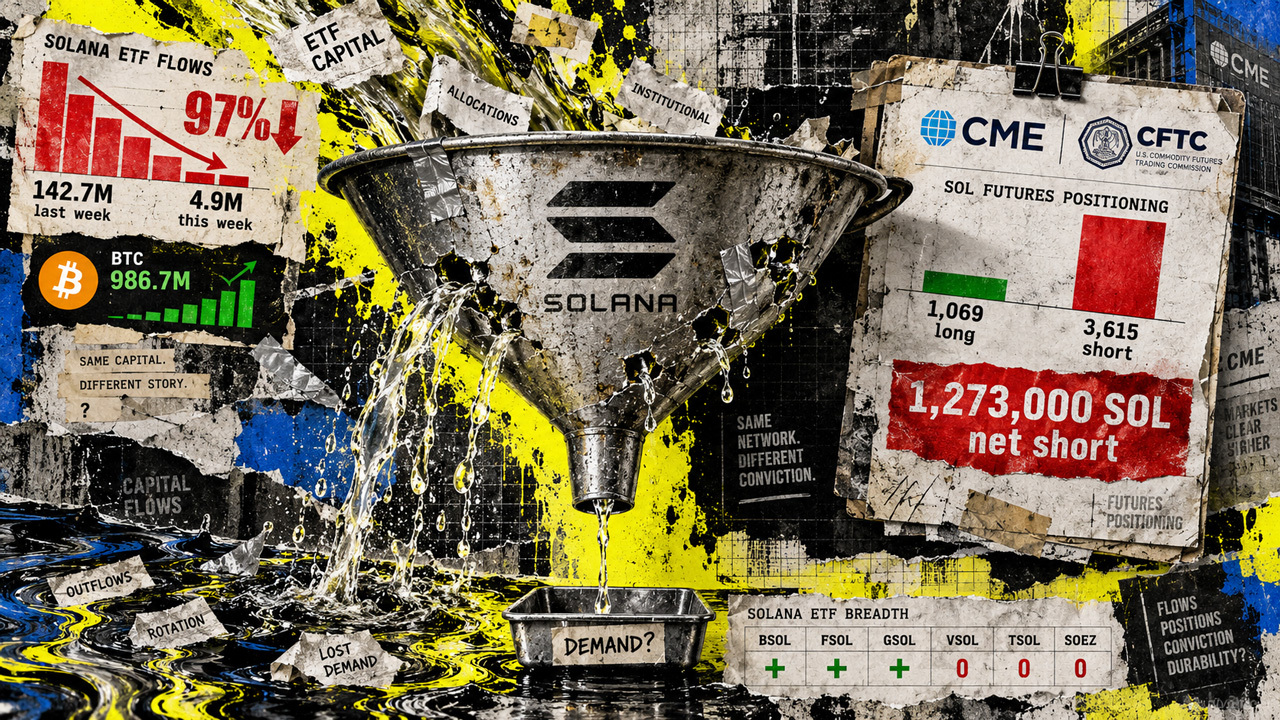
Solana’s weekly ETF inflows fell 97% while CME funds became less net short
Solana’s US ETF inflows fell about 97% in the week ending Sept. 4, leaving the funds with a small positive balance as Bitcoin’s al...

ZEC Hits $1,025 ATH After 6,300% Surge From 2024 Lows as BTC Awaits $80K Breakout
The move marks a sharp reversal for ZEC from the deep drawdown that followed its 2018 peak and represents a gain of roughly 6,300%...

XRP Price Prediction: Spot Trading Volume Hits Highest in 6 Months
XRP price is trading around the $1.40 to $1.45 area after a sharp rebound pushed the token back toward $1.50 in a bullish predicti...

Arthur Hayes calls EUR/JPY prices crypto’s smoke alarm, but the Fed’s plumbing still shows no fire
Arthur Hayes has a new market alarm for crypto traders: EUR/JPY. The pair has started to fall, yet the Federal Reserve channels th...