XRP Price Shows Increased Strength: Can It Sustain The Recovery?
XRP price extended its increase above the $0.440 resistance zone. The price is showing positive signs and might rise further above the $0.4550 resistance level. XRP price is attempting a recovery wave above the $0.4400 z...

XRP price extended its increase above the $0.440 resistance zone. The price is showing positive signs and might rise further above the $0.4550 resistance level.
- XRP price is attempting a recovery wave above the $0.4400 zone.
- The price is now trading above $0.440 and the 100-hourly Simple Moving Average.
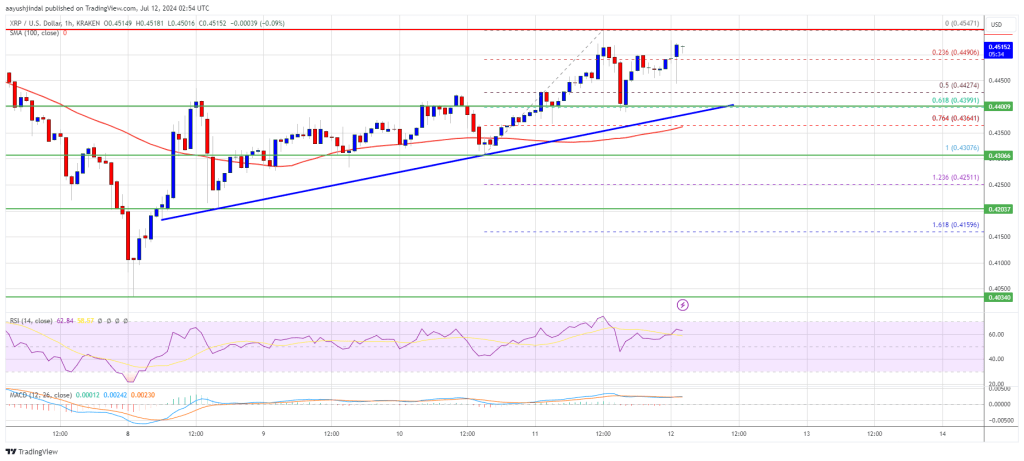
- There is a key bullish trend line forming with support at $0.4390 on the hourly chart of the XRP/USD pair (data source from Kraken).
- The pair could extend gains if there is a close above the $0.450 resistance level.
XRP price remained in a positive zone above the $0.4250 level and extended its recovery wave, like Ethereum and outperformed Bitcoin. The price was able to climb above the $0.4320 and $0.4400 resistance levels.
The price even cleared the $0.4450 level and spiked above $0.450. A high was formed at $0.4547 and the price is now consolidating gains. There was a minor decline below the $0.4450 level. The price tested the 50% Fib retracement level of the upward move from the $0.4307 swing low to the $0.4547 high.
The price is now trading above $0.440 and the 100-hourly Simple Moving Average. Besides, there is a key bullish trend line forming with support at $0.4390 on the hourly chart of the XRP/USD pair. The trend line is close to the 61.8% Fib retracement level of the upward move from the $0.4307 swing low to the $0.4547 high.
On the upside, the price is facing resistance near the $0.4550 level. The first major resistance is near the $0.4620 level. The next key resistance could be $0.4650. A clear move above the $0.4650 resistance might send the price toward the $0.480 resistance. The next major resistance is near the $0.4880 level. Any more gains might send the price toward the $0.500 resistance.
Are Dips Supported?If XRP fails to clear the $0.4550 resistance zone, it could start a downside correction. Initial support on the downside is near the $0.4450 level.
The next major support is at $0.4390 and the trend line. If there is a downside break and a close below the $0.4390 level, the price might continue to decline toward the $0.4220 support in the near term.
Technical Indicators
Hourly MACD – The MACD for XRP/USD is now gaining pace in the bullish zone.
Hourly RSI (Relative Strength Index) – The RSI for XRP/USD is now above the 50 level.
Major Support Levels – $0.4450 and $0.4390.
Major Resistance Levels – $0.4550 and $0.4800.
Original source
Read on NewsBTCRelated market context

Standard Chartered Says Bitcoin Bottomed Near $59,000 As Crypto Winter Ends
TL;DR Standard Chartered’s Geoffrey Kendrick reportedly says Bitcoin’s $59,000 area marked the cycle bottom. The note cites SpaceX...

Google Gemini AI Predicts Jaw-Dropping XRP Price For Next 90 Days
Google Gemini AI just put XRP back under the spotlight, predicting it is tightly wound for a major breakout toward $1.60 to $1.80...

Elon Musk SpaceX AI Predicts Incredible Bitcoin Price For Next 30 Days
Here is the thing about capitulation calls. They only sound smart in hindsight. Right now, with Bitcoin price scraping along the l...

Bitcoin price challenges $64,000 weekend wall – needing a breakout or risk a deeper correction
Bitcoin reclaimed $64,000 on June 12 and touched an intraday high of $64,301 in the same session that spot ETF flows finally flipp...

Bitcoin Mining Cost Model Points To $47,000 Floor, But Analysts Urge Caution
TL;DR Crypto Rover says Bitcoin has never bottomed below electrical production cost, currently estimated at $47,000. Mining-cost m...

Bitcoin rises above $64,000 after Pakistan prime minister says Iran peace deal is near
Bitcoin traded above $64,000 on Saturday, supported by its strongest ETF inflows in a month and growing optimism around geopolitic...