XRP Price Shows Resilience: Is a Bold Move Around the Corner?
XRP price extended losses and dived toward the $0.5320 support. The price remained well-bid and is currently attempting a fresh recovery above $0.550. XRP price started a decent increase from the $0.5330 zone. The price...

XRP price extended losses and dived toward the $0.5320 support. The price remained well-bid and is currently attempting a fresh recovery above $0.550.
- XRP price started a decent increase from the $0.5330 zone.
- The price is now trading below $0.560 and the 100-hourly Simple Moving Average.
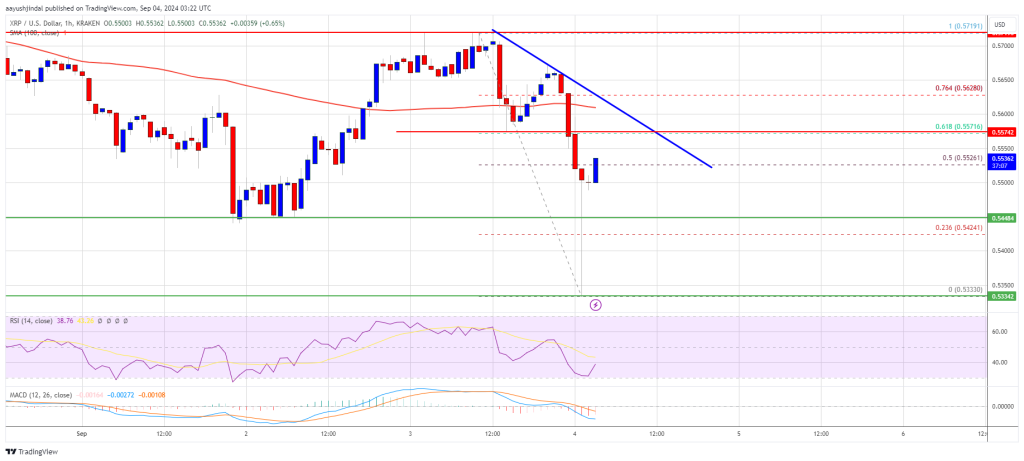
- There is a new connecting bearish trend line forming with resistance at $0.5570 on the hourly chart of the XRP/USD pair (data source from Kraken).
- The pair could climb higher toward the $0.600 zone if it clears the $0.5620 resistance zone.
XRP price extended losses like Bitcoin and Ethereum. The price even dived below the $0.5440 support level. It tested the $0.5330 zone. A low was formed at $0.5333 and the price is now attempting a fresh recovery wave.
There was a move above the $0.5420 and $0.5440 resistance levels. The price was able to clear the 23.6% Fib retracement level of the downward move from the $0.5719 swing high to the $0.5333 low. It is also attempting a close above $0.5520.
The price is now trading well below $0.5750 and the 100-hourly Simple Moving Average. On the upside, the price might face resistance near the $0.5550 level. The first major resistance is near the $0.5570 level. There is also a new connecting bearish trend line forming with resistance at $0.5570 on the hourly chart of the XRP/USD pair.
The trend line is close to the 61.8% Fib retracement level of the downward move from the $0.5719 swing high to the $0.5333 low. The next key resistance could be $0.5720. A clear move above the $0.5720 resistance might send the price toward the $0.5850 resistance.
The next major resistance is near the $0.5920 level. Any more gains might send the price toward the $0.600 resistance or even $0.6060 in the near term.
Another Decline?If XRP fails to clear the $0.5570 resistance zone, it could start another decline. Initial support on the downside is near the $0.5480 level. The next major support is at $0.5420.
If there is a downside break and a close below the $0.5420 level, the price might continue to decline toward the $0.5320 support in the near term. The next major support sits at $0.520.
Technical Indicators
Hourly MACD – The MACD for XRP/USD is now losing pace in the bearish zone.
Hourly RSI (Relative Strength Index) – The RSI for XRP/USD is now below the 50 level.
Major Support Levels – $0.5420 and $0.5320.
Major Resistance Levels – $0.5570 and $0.5720.
Original source
Read on NewsBTCRelated market context

Uranium Holds Above $85 as Mining ETF Rebounds From June Sell-Off
The latest charts display that the market is divided into stable physical prices and uranium shares trying to regain momentum afte...

Bitcoin price challenges $64,000 weekend wall – needing a breakout or risk a deeper correction
Bitcoin reclaimed $64,000 on June 12 and touched an intraday high of $64,301 in the same session that spot ETF flows finally flipp...

Standard Chartered Says Bitcoin Bottomed Near $59,000 As Crypto Winter Ends
TL;DR Standard Chartered’s Geoffrey Kendrick reportedly says Bitcoin’s $59,000 area marked the cycle bottom. The note cites SpaceX...

Google Gemini AI Predicts Jaw-Dropping XRP Price For Next 90 Days
Google Gemini AI just put XRP back under the spotlight, predicting it is tightly wound for a major breakout toward $1.60 to $1.80...

Bitcoin Mining Cost Model Points To $47,000 Floor, But Analysts Urge Caution
TL;DR Crypto Rover says Bitcoin has never bottomed below electrical production cost, currently estimated at $47,000. Mining-cost m...

Are 24/7 CME Bitcoin futures a volatility cure — or a new leverage trap?
Wall Street got to trade Bitcoin around the clock just in time to watch the market fall apart. CME Group launched 24/7 trading for...