XRP Price Slips Again, Bears Tighten Grip As Momentum Turns Negative
XRP price started a fresh decline below $2.50. The price is now showing bearish signs and might extend losses below $2.280. XRP price is moving lower below the $2.40 zone. The price is now trading below $2.40 and the 100...

XRP price started a fresh decline below $2.50. The price is now showing bearish signs and might extend losses below $2.280.
- XRP price is moving lower below the $2.40 zone.
- The price is now trading below $2.40 and the 100-hourly Simple Moving Average.
- There is a key bearish trend line forming with resistance at $2.40 on the hourly chart of the XRP/USD pair (data source from Kraken).
- The pair could start a fresh increase if it clears the $2.50 resistance.
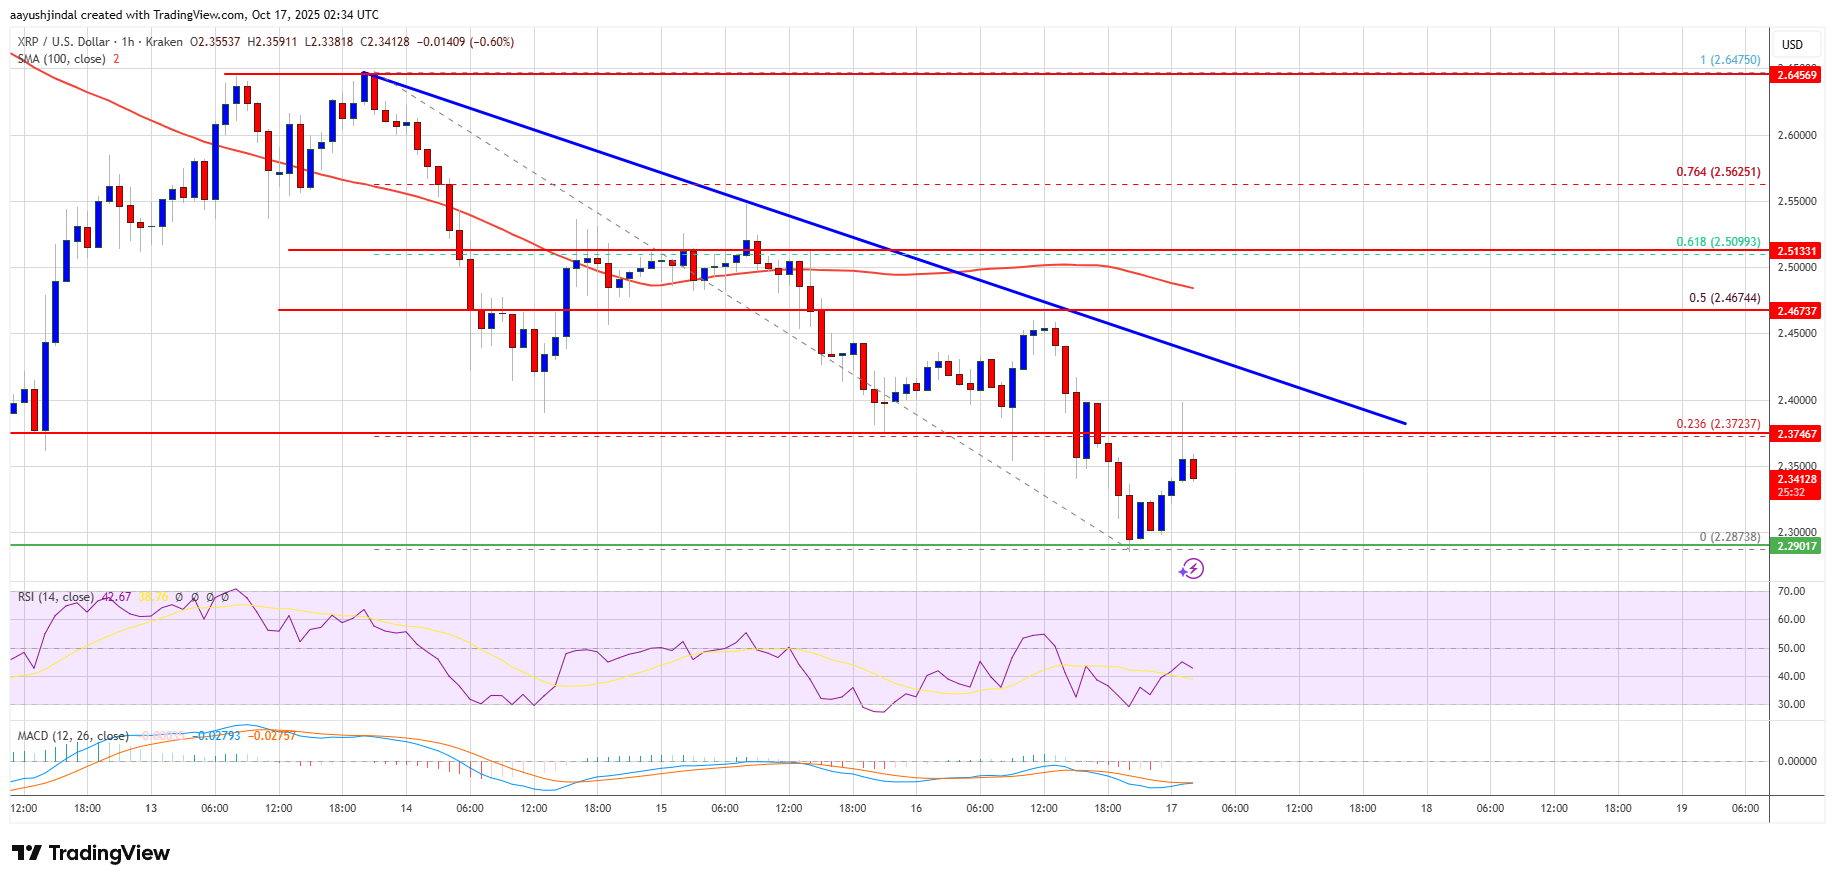
XRP price remained below the $2.60 barrier and started a fresh decline, like Bitcoin and Ethereum. The price dipped below $2.420 and $2.40 to enter a short-term bearish zone.
The price even spiked below $2.30. A low was formed at $2.287, and the price is now consolidating losses. There was a minor recovery, and the price tested the 23.6% Fib retracement level of the recent decline from the $2.647 swing high to the $2.287 low.
The price is now trading below $2.40 and the 100-hourly Simple Moving Average. Besides, there is a key bearish trend line forming with resistance at $2.40 on the hourly chart of the XRP/USD pair.
If there is a fresh upward move, the price might face resistance near the $2.40 level and the trend line. The first major resistance is near the $2.450 level, above which the price could rise and test the 50% Fib retracement level of the recent decline from the $2.647 swing high to the $2.287 low at $2.467.
A clear move above the $2.4670 resistance might send the price toward the $2.50 resistance. Any more gains might send the price toward the $2.550 resistance. The next major hurdle for the bulls might be near $2.60.
Another Drop?If XRP fails to clear the $2.40 resistance zone, it could start a fresh decline. Initial support on the downside is near the $2.30 level. The next major support is near the $2.280 level.
If there is a downside break and a close below the $2.280 level, the price might continue to decline toward $2.250. The next major support sits near the $2.220 zone, below which the price could continue lower toward $2.120.
Technical Indicators
Hourly MACD – The MACD for XRP/USD is now gaining pace in the bearish zone.
Hourly RSI (Relative Strength Index) – The RSI for XRP/USD is now below the 50 level.
Major Support Levels – $2.30 and $2.280.
Major Resistance Levels – $2.40 and $2.450.
Original source
Read on NewsBTCRelated market context

Ethereum Nears 200 Million Non-Empty Wallets Despite Market Uncertainty
Despite persistent market uncertainty and bearish sentiment across parts of the cryptocurrency sector, Ethereum is approaching a s...

Bitcoin (BTC) Price Prediction: BTC Eyes $70K Liquidity Sweep as Whales Reclaim Control Near $62K
Market data suggests that long-term holders remain largely inactive, while whale activity is beginning to recover, creating an int...

Ethereum Futures Just Hit A Binance Record: Are Traders Calling The Bottom?
Ethereum derivatives activity is flashing a fresh signal on Binance, where open interest measured in ETH terms has reached a new a...

XRP aims for $0.90 as ETF demand battles selling pressure from whales
XRP is trading at $1.11, down roughly 17% from its June opening, having set a new 2026 low on June 5 and shed $8 billion in market...

Ethereum Price Prediction: 3 Million ETH Rushes Into Staking as Sellers Vanish
Is nobody leaving Ethereum? A record 36 million ETH is now locked in staking, roughly 29–30% of the circulating supply, and the va...

The 3-Part Impulse That Shows Where The XRP Price Is Headed Next
XRP bulls are trying to turn a brutal selloff into something bigger than a relief bounce. An interesting setup shows a possible th...