XRP Price Slips But Will The 100-SMA Ignite A Comeback?
XRP price extended gains and tested the $0.5420 level. The price is now correcting gains and testing the $0.5320 support zone. XRP price could gain pace for a move above the $0.5420 resistance zone. The price is now trad...
XRP price extended gains and tested the $0.5420 level. The price is now correcting gains and testing the $0.5320 support zone.
- XRP price could gain pace for a move above the $0.5420 resistance zone.
- The price is now trading above $0.5320 and the 100-hourly Simple Moving Average.
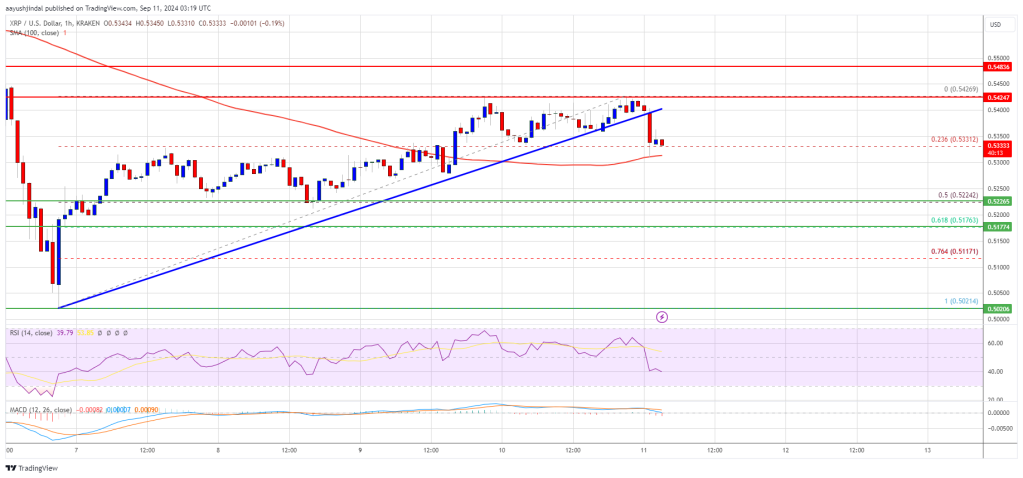
- There was a break below a connecting bullish trend line with support at $0.540 on the hourly chart of the XRP/USD pair (data source from Kraken).
- The pair could gain bullish momentum if it clears the $0.5420 and $0.5450 resistance levels.
XRP price started a recovery wave above the $0.5220 level like Bitcoin and Ethereum. The price was able to climb above the $0.5250 and $0.5320 resistance levels.
Finally, the price spiked toward the $0.5420 level before the bears emerged. The price formed a top near $0.5426 and is now correcting gains. There was a move below the $0.540 level. The price dipped below the 23.6% Fib retracement level of the upward move from the $0.5021 swing low to the $0.5426 high.
There was also a break below a connecting bullish trend line with support at $0.540 on the hourly chart of the XRP/USD pair. The price is now trading above $0.5320 and the 100-hourly Simple Moving Average.
On the upside, the price might face resistance near the $0.5400 level. The first major resistance is near the $0.5420 level. The next key resistance could be $0.5450.
A clear move above the $0.5450 resistance might send the price toward the $0.5550 resistance. The next major resistance is near the $0.5720 level. Any more gains might send the price toward the $0.5950 resistance or even $0.600 in the near term.
Another Decline?If XRP fails to clear the $0.540 resistance zone, it could start another decline. Initial support on the downside is near the $0.5320 level and the 100 hourly SMA. The next major support is $0.5225 or the 50% Fib retracement level of the upward move from the $0.5021 swing low to the $0.5426 high.
If there is a downside break and a close below the $0.5225 level, the price might continue to decline toward the $0.5110 support in the near term. The next major support sits at $0.5020.
Technical Indicators
Hourly MACD – The MACD for XRP/USD is now losing pace in the bullish zone.
Hourly RSI (Relative Strength Index) – The RSI for XRP/USD is now below the 50 level.
Major Support Levels – $0.5320 and $0.5225.
Major Resistance Levels – $0.5400 and $0.5420.
Original source
Read on NewsBTCRelated market context

Uranium Holds Above $85 as Mining ETF Rebounds From June Sell-Off
The latest charts display that the market is divided into stable physical prices and uranium shares trying to regain momentum afte...

Standard Chartered Says Bitcoin Bottomed Near $59,000 As Crypto Winter Ends
TL;DR Standard Chartered’s Geoffrey Kendrick reportedly says Bitcoin’s $59,000 area marked the cycle bottom. The note cites SpaceX...

Google Gemini AI Predicts Jaw-Dropping XRP Price For Next 90 Days
Google Gemini AI just put XRP back under the spotlight, predicting it is tightly wound for a major breakout toward $1.60 to $1.80...

Bitcoin price challenges $64,000 weekend wall – needing a breakout or risk a deeper correction
Bitcoin reclaimed $64,000 on June 12 and touched an intraday high of $64,301 in the same session that spot ETF flows finally flipp...

Are 24/7 CME Bitcoin futures a volatility cure — or a new leverage trap?
Wall Street got to trade Bitcoin around the clock just in time to watch the market fall apart. CME Group launched 24/7 trading for...

Tether USDT Briefly Overtakes Ethereum in Market Cap: A $187B Wake-Up Call
For a few hours, earlier this week, Tether USDT stablecoin held a higher market cap than Ethereum, the first time that has happene...