XRP Price Slips From Highs as Market Pauses to Reassess Bullish Momentum
XRP price started a decent increase above $2.120. The price is now correcting gains and might struggle to stay in a positive zone. XRP price started a downside correction and tested the $2.080 zone. The price is now trad...
XRP price started a decent increase above $2.120. The price is now correcting gains and might struggle to stay in a positive zone.
- XRP price started a downside correction and tested the $2.080 zone.
- The price is now trading below $2.120 and the 100-hourly Simple Moving Average.
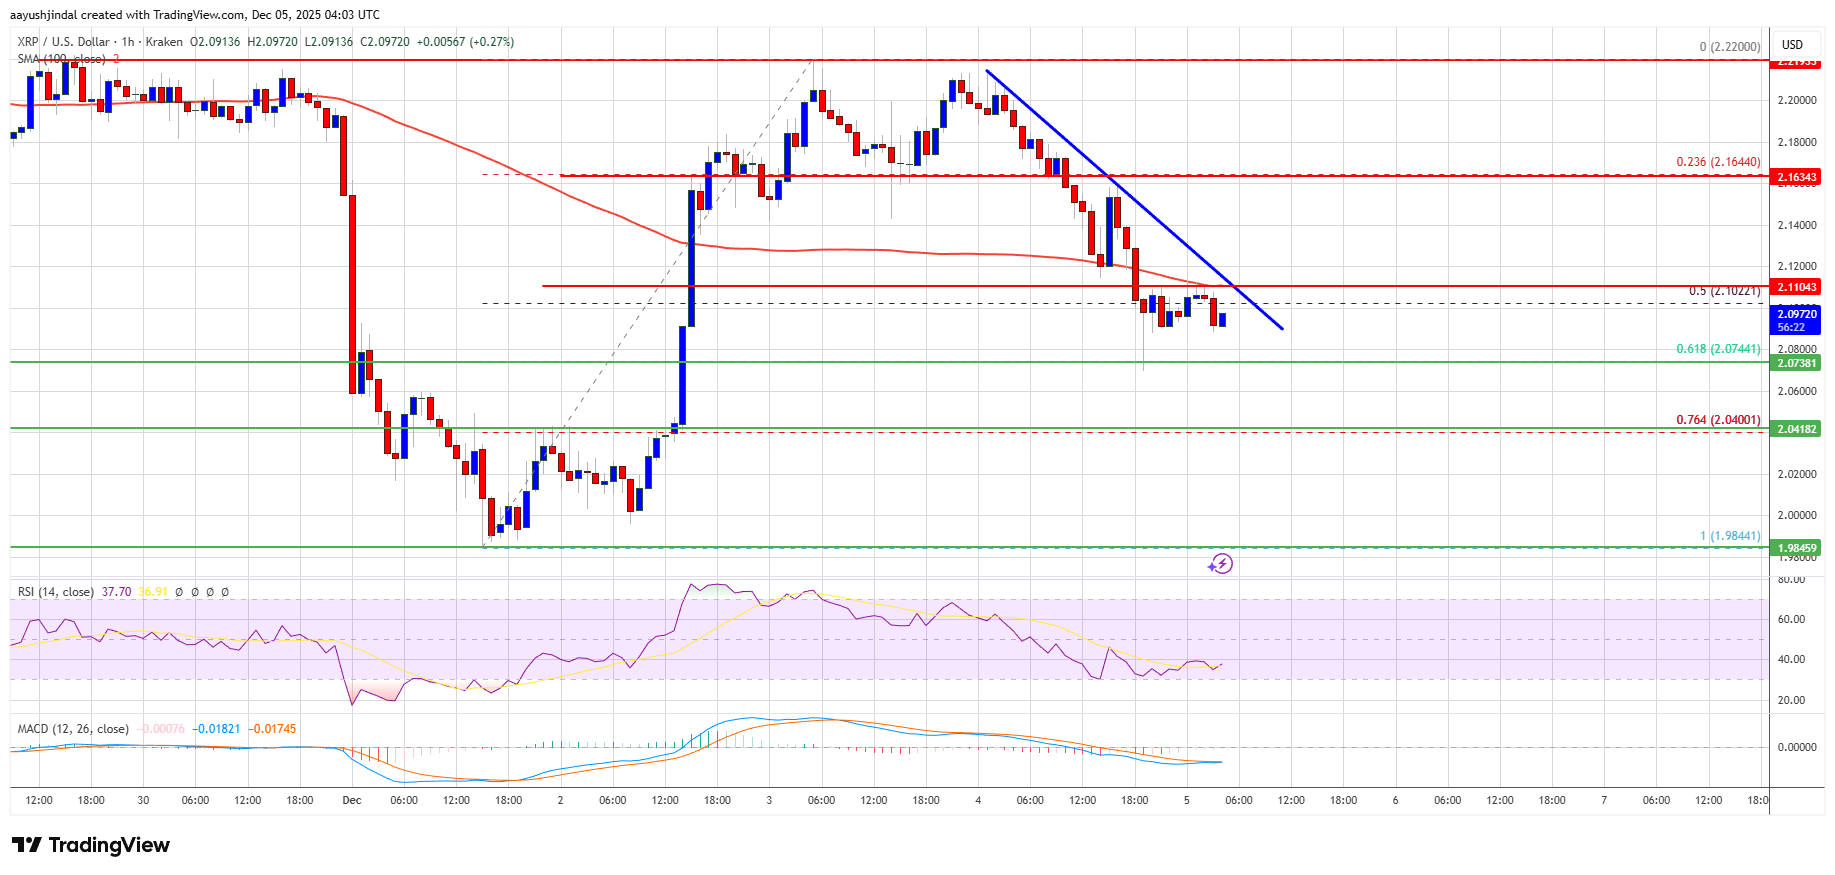
- There is a bearish trend line forming with resistance at $2.110 on the hourly chart of the XRP/USD pair (data source from Kraken).
- The pair could start another increase if it clears $2.150.
XRP price started a downside correction from the $2.220 zone, like Bitcoin and Ethereum. The price dipped below the $2.20 and $2.150 levels to enter a consolidation phase.
The price even dipped below the 50% Fib retracement level of the upward move from the $1.984 swing low to the $2.220 high. Besides, there is a bearish trend line forming with resistance at $2.110 on the hourly chart of the XRP/USD pair. However, the bulls remained active above the $2.080 support.
The price is now trading below $2.10 and the 100-hourly Simple Moving Average. If there is a fresh upward move, the price might face resistance near the $2.110 level and the trend line.
The first major resistance is near the $2.150 level, above which the price could rise and test $2.220. A clear move above the $2.220 resistance might send the price toward the $2.2850 resistance. Any more gains might send the price toward the $2.350 resistance. The next major hurdle for the bulls might be near $2.420.
Another Decline?If XRP fails to clear the $2.150 resistance zone, it could start a fresh decline. Initial support on the downside is near the $2.080 level and the 61.8% Fib retracement level of the upward move from the $1.984 swing low to the $2.220 high. The next major support is near the $2.040 level.
If there is a downside break and a close below the $2.040 level, the price might continue to decline toward $2.00. The next major support sits near the $1.9850 zone, below which the price could continue lower toward $1.920.
Technical Indicators
Hourly MACD – The MACD for XRP/USD is now gaining pace in the bearish zone.
Hourly RSI (Relative Strength Index) – The RSI for XRP/USD is now below the 50 level.
Major Support Levels – $2.080 and $2.040.
Major Resistance Levels – $2.110 and $2.150.
Original source
Read on NewsBTCRelated market context

Bitcoin (BTC) Price Prediction: BTC Eyes $70K Liquidity Sweep as Whales Reclaim Control Near $62K
Market data suggests that long-term holders remain largely inactive, while whale activity is beginning to recover, creating an int...

Ethereum Nears 200 Million Non-Empty Wallets Despite Market Uncertainty
Despite persistent market uncertainty and bearish sentiment across parts of the cryptocurrency sector, Ethereum is approaching a s...
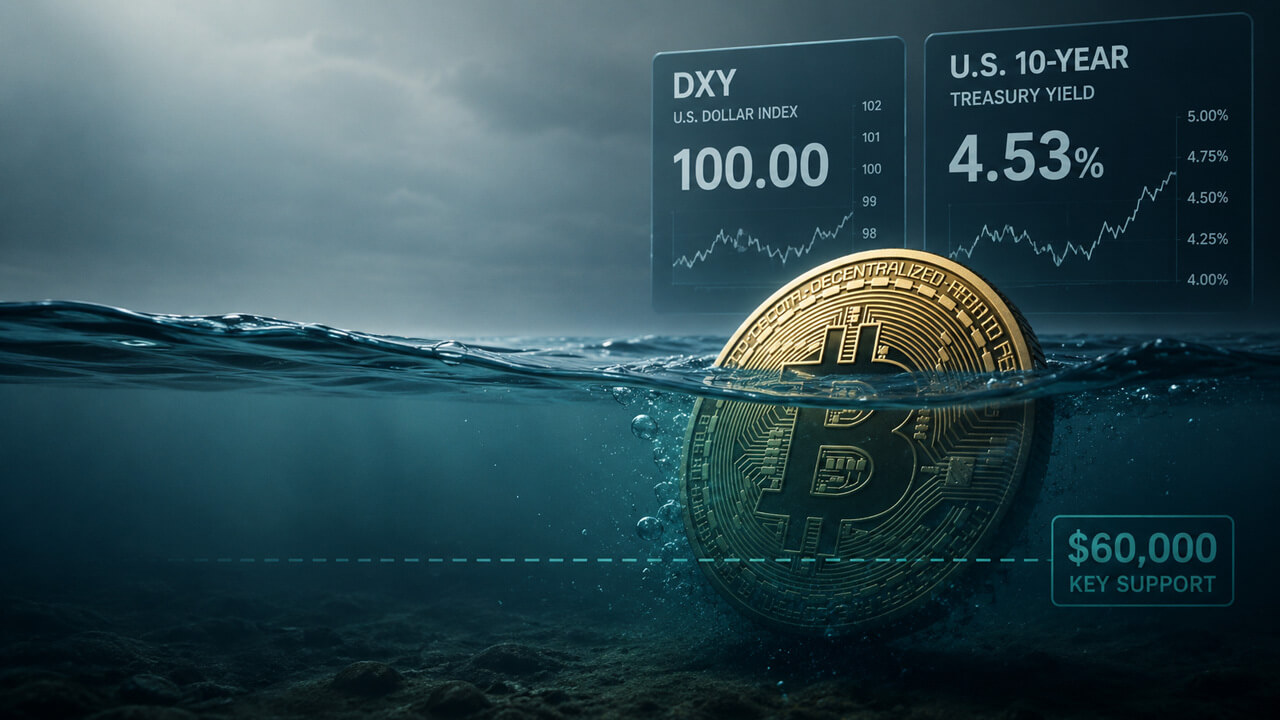
Bitcoin’s $60,000 support is still a bet on the dollar breaking
Glassnode's latest Week On-chain report says Bitcoin has entered a deep discount phase, with over 95% of short-term holders underw...

Ethereum Price Prediction: 3 Million ETH Rushes Into Staking as Sellers Vanish
Is nobody leaving Ethereum? A record 36 million ETH is now locked in staking, roughly 29–30% of the circulating supply, and the va...

Most Traders Will Scroll Past This Grok AI Bitcoin Predicts, Big Mistake
Elon Musk Grok AI just looked at a Bitcoin chart down more than 50% and predicts it’s a classic accumulation zone, targeting $150,...

XRP Price Prediction: Japan Regulates Crypto like Stocks, XRP to Benefit First
Japan just rewrote the rules. XRP price is battling below resistance at $1.10, but it’s prediction is getting bullish as Japan’s p...