XRP Price Slips Lower – Bears Could Trigger A Sharp Decline If Support Breaks
XRP price started a fresh decline below $2.90. The price is now struggling and might continue to move down if it trades below $2.820. XRP price is slowly moving lower below the $2.90 zone. The price is now trading below...

XRP price started a fresh decline below $2.90. The price is now struggling and might continue to move down if it trades below $2.820.
- XRP price is slowly moving lower below the $2.90 zone.
- The price is now trading below $2.90 and the 100-hourly Simple Moving Average.
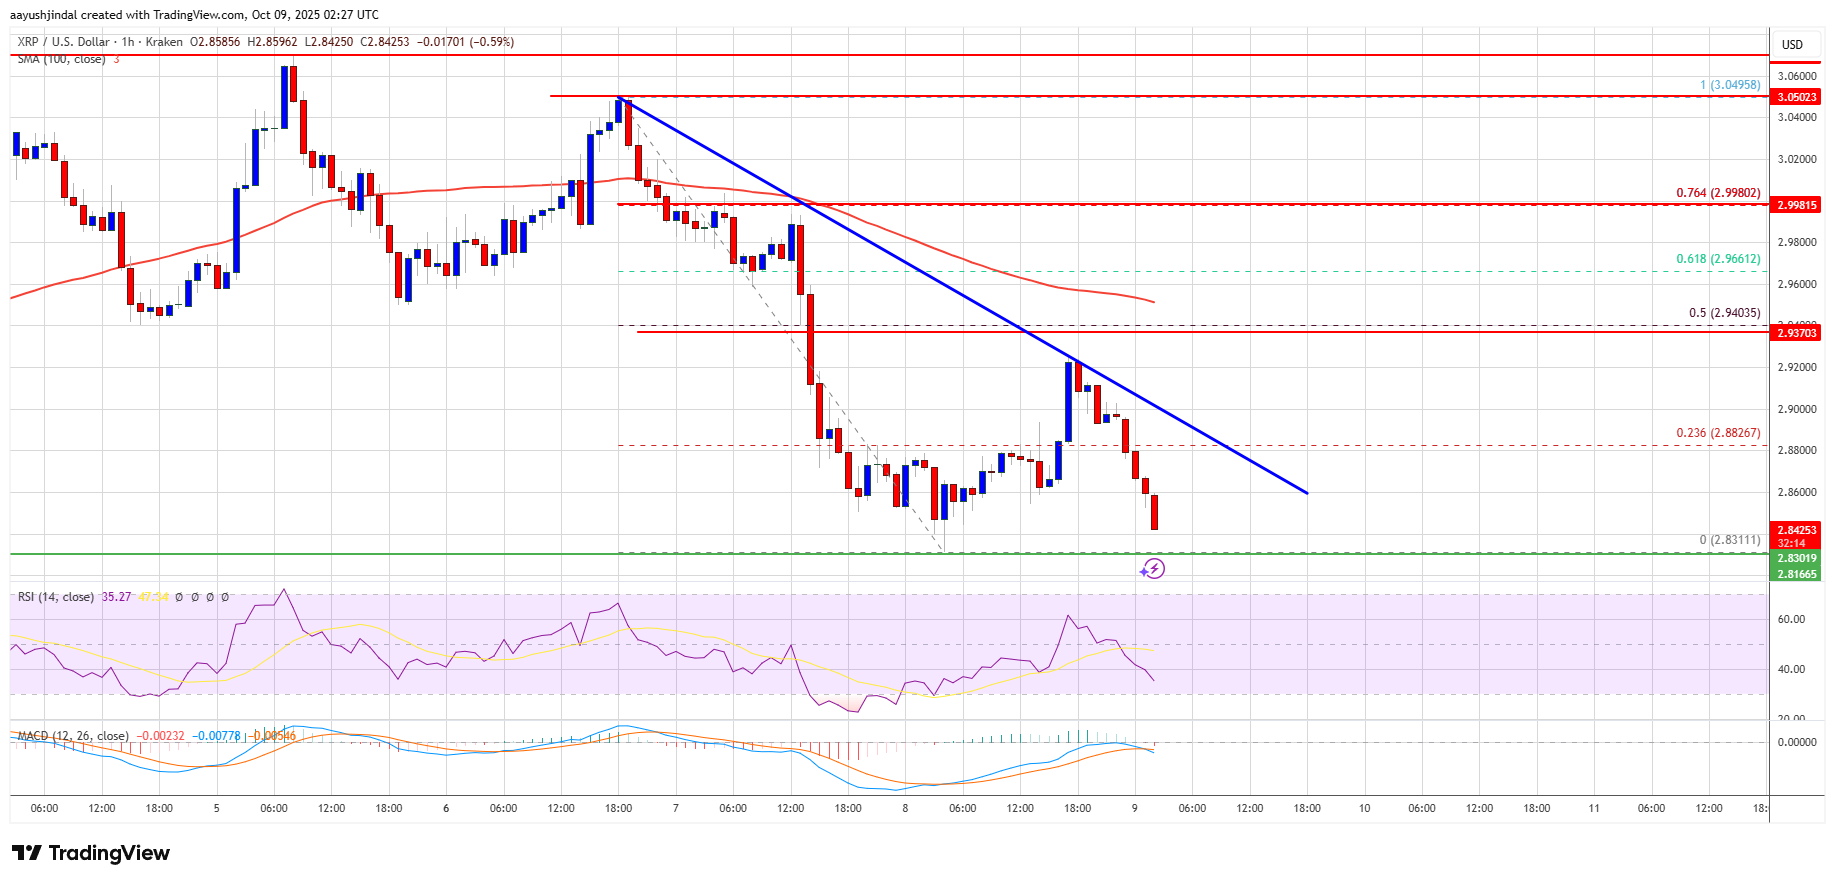
- There is a key bearish trend line forming with resistance at $2.880 on the hourly chart of the XRP/USD pair (data source from Kraken).
- The pair could start a fresh decline if it settles below $2.820.
XRP price failed to stay above $3.00 and started a fresh decline, like Bitcoin and Ethereum. The price declined below $2.950 and $2.920 to enter a short-term bearish zone.
The price tested the $2.8320 zone and recently attempted a recovery wave. It climbed above the 23.6% Fib retracement level of the downward move from the $3.05 swing high to the $2.8320 swing low. However, the bears remained active near $2.920.
The price is now trading below $2.90 and the 100-hourly Simple Moving Average. Besides, there is a key bearish trend line forming with resistance at $2.880 on the hourly chart of the XRP/USD pair.
If there is a fresh upward move, the price might face resistance near the $2.880 level. The first major resistance is near the $2.920 level. A clear move above the $2.920 resistance might send the price toward the $2.950 resistance.
Any more gains might send the price toward the $3.00 resistance or the 76.4% Fib retracement level of the downward move from the $3.05 swing high to the $2.8320 swing low. The next major hurdle for the bulls might be near $3.050.
More Losses?If XRP fails to clear the $2.920 resistance zone, it could start a fresh decline. Initial support on the downside is near the $2.820 level. The next major support is near the $2.80 level.
If there is a downside break and a close below the $2.80 level, the price might continue to decline toward $2.7250. The next major support sits near the $2.650 zone, below which the price could continue lower toward $2.60.
Technical Indicators
Hourly MACD – The MACD for XRP/USD is now gaining pace in the bearish zone.
Hourly RSI (Relative Strength Index) – The RSI for XRP/USD is now below the 50 level.
Major Support Levels – $2.820 and $2.80.
Major Resistance Levels – $2.920 and $2.950.
Original source
Read on NewsBTCRelated market context

Bitcoin (BTC) Price Prediction: BTC Eyes $70K Liquidity Sweep as Whales Reclaim Control Near $62K
Market data suggests that long-term holders remain largely inactive, while whale activity is beginning to recover, creating an int...

The 3-Part Impulse That Shows Where The XRP Price Is Headed Next
XRP bulls are trying to turn a brutal selloff into something bigger than a relief bounce. An interesting setup shows a possible th...

Most Traders Will Scroll Past This Grok AI Bitcoin Predicts, Big Mistake
Elon Musk Grok AI just looked at a Bitcoin chart down more than 50% and predicts it’s a classic accumulation zone, targeting $150,...

XRP Price Prediction: Japan Regulates Crypto like Stocks, XRP to Benefit First
Japan just rewrote the rules. XRP price is battling below resistance at $1.10, but it’s prediction is getting bullish as Japan’s p...

Ethereum Nears 200 Million Non-Empty Wallets Despite Market Uncertainty
Despite persistent market uncertainty and bearish sentiment across parts of the cryptocurrency sector, Ethereum is approaching a s...

XRP aims for $0.90 as ETF demand battles selling pressure from whales
XRP is trading at $1.11, down roughly 17% from its June opening, having set a new 2026 low on June 5 and shed $8 billion in market...