XRP Price Steadies Above Support: Gearing Up for a Breakout?
XRP price is holding the key support at $0.5220. The bulls could aim for a fresh increase unless there is a close below the $0.5220 support. XRP is struggling to start a fresh increase above the $0.5350 resistance zone....

XRP price is holding the key support at $0.5220. The bulls could aim for a fresh increase unless there is a close below the $0.5220 support.
- XRP is struggling to start a fresh increase above the $0.5350 resistance zone.
- The price is now trading below $0.5320 and the 100-hourly Simple Moving Average.
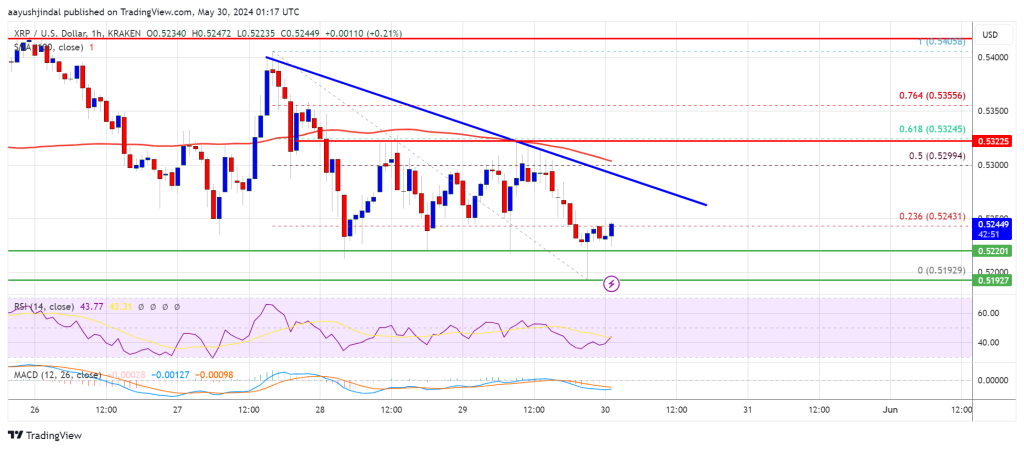
- There is a key bearish trend line forming with resistance near $0.5280 on the hourly chart of the XRP/USD pair (data source from Kraken).
- The pair could start a fresh increase unless the bears push the price below $0.5220.
XRP price again saw a bearish move and retested the $0.5220 support zone like Bitcoin and Ethereum. There was also a spike below the $0.5220 support zone, but the bulls were active.
A low was formed at $0.5192 and the price is back above $0.5220. The price is now trading near the 23.6% Fib retracement level of the downward wave from the $0.5405 swing high to the $0.5192 low. It is now trading below $0.5320 and the 100-hourly Simple Moving Average.
On the upside, the price is facing resistance near the $0.5280 level. There is also a key bearish trend line forming with resistance near $0.5280 on the hourly chart of the XRP/USD pair.
The first key resistance is near $0.5300 or the 61.8% Fib retracement level of the downward wave from the $0.5405 swing high to the $0.5192 low. A close above the $0.5300 resistance zone could send the price higher. The next key resistance is near $0.540.
If there is a close above the $0.540 resistance level, there could be a steady increase toward the $0.5450 resistance. Any more gains might send the price toward the $0.5650 resistance.
More Downsides?If XRP fails to clear the $0.5280 resistance zone, it could continue to move down. Initial support on the downside is near the $0.5220 level.
The next major support is at $0.5120. If there is a downside break and a close below the $0.5120 level, the price might accelerate lower. In the stated case, the price could decline and retest the $0.50 support in the near term.
Technical Indicators
Hourly MACD – The MACD for XRP/USD is now losing pace in the bearish zone.
Hourly RSI (Relative Strength Index) – The RSI for XRP/USD is now below the 50 level.
Major Support Levels – $0.5220 and $0.5120.
Major Resistance Levels – $0.5280 and $0.5300.
Original source
Read on NewsBTCRelated market context

Uranium Holds Above $85 as Mining ETF Rebounds From June Sell-Off
The latest charts display that the market is divided into stable physical prices and uranium shares trying to regain momentum afte...

Standard Chartered Says Bitcoin Bottomed Near $59,000 As Crypto Winter Ends
TL;DR Standard Chartered’s Geoffrey Kendrick reportedly says Bitcoin’s $59,000 area marked the cycle bottom. The note cites SpaceX...

Elon Musk’s trillionaire status puts his net worth above crypto’s entire market cap outside Bitcoin
Elon Musk has become the first person in modern history to amass a personal net worth exceeding $1 trillion, crossing the historic...

Google Gemini AI Predicts Jaw-Dropping XRP Price For Next 90 Days
Google Gemini AI just put XRP back under the spotlight, predicting it is tightly wound for a major breakout toward $1.60 to $1.80...

Bitcoin price challenges $64,000 weekend wall – needing a breakout or risk a deeper correction
Bitcoin reclaimed $64,000 on June 12 and touched an intraday high of $64,301 in the same session that spot ETF flows finally flipp...

Bitcoin Mining Cost Model Points To $47,000 Floor, But Analysts Urge Caution
TL;DR Crypto Rover says Bitcoin has never bottomed below electrical production cost, currently estimated at $47,000. Mining-cost m...