XRP Price Still Have A Chance For A Bullish Streak: Here’s How
XRP price is struggling to clear the $0.6420 resistance. The price must stay above the $0.600 support to attempt a fresh increase in the near term. XRP is slowly moving lower from the $0.6420 resistance zone. The price i...

XRP price is struggling to clear the $0.6420 resistance. The price must stay above the $0.600 support to attempt a fresh increase in the near term.
- XRP is slowly moving lower from the $0.6420 resistance zone.
- The price is now trading below $0.6120 and the 100 simple moving average (4 hours).
- There is a key bullish trend line forming with support at $0.6020 on the 4-hour chart of the XRP/USD pair (data source from Kraken).
- The pair could gain bearish momentum if there is a close below the $0.600 support.
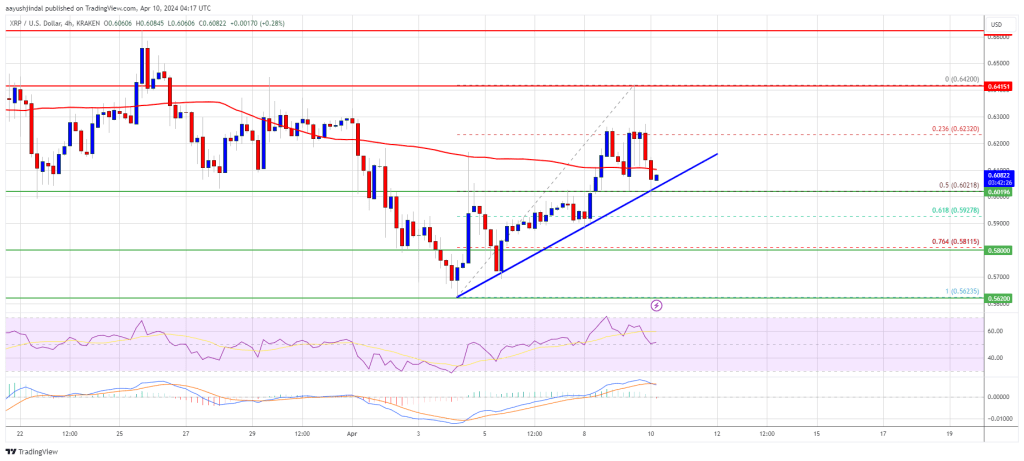
After a steady increase, XRP price struggled to clear the $0.6420 resistance. It started a fresh decline below the $0.6250 support, like Bitcoin and Ethereum.
There was a move below the $0.6200 support. The price traded below the 23.6% Fib retracement level of the upward move from the $0.5622 swing low to the $0.6420 high. The price is now trading below $0.6120 and the 100 simple moving average (4 hours).
It is testing the $0.6020 support and the 50% Fib retracement level of the upward move from the $0.5622 swing low to the $0.6420 high. There is also a key bullish trend line forming with support at $0.6020 on the 4-hour chart of the XRP/USD pair.
Immediate resistance is near the $0.610 level and the 100 simple moving average (4 hours). The next key resistance is near $0.6220. low. A close above the $0.6220 resistance zone could spark a strong increase. The next key resistance is near $0.6420.
Source: XRPUSD on TradingView.com
If the bulls remain in action above the $0.6420 resistance level, there could be a rally toward the $0.6620 resistance. Any more gains might send the price toward the $0.700 resistance.
More Losses?If XRP fails to clear the $0.6220 resistance zone, it could start another decline. Initial support on the downside is near the $0.6020 zone and the trend line.
The next major support is at $0.580. If there is a downside break and a close below the $0.580 level, the price might accelerate lower. In the stated case, the price could retest the $0.5450 support zone.
Technical Indicators
4-Hours MACD – The MACD for XRP/USD is now gaining pace in the bearish zone.
4-Hours RSI (Relative Strength Index) – The RSI for XRP/USD is now below the 50 level.
Major Support Levels – $0.6020, $0.580, and $0.5450.
Major Resistance Levels – $0.610, $0.6220, and $0.6420.
Original source
Read on NewsBTCRelated market context

Bitcoin Stabilizes Near Key Zone, But Glassnode Warns Capital Flows Remain Weak
Bitcoin’s rebound from the $60,000 area has given bulls something to work with, but Glassnode’s latest market read suggests the re...

BTC News Today: Bitcoin Climbs Toward $66K as Trump Reveals US-Iran Peace Deal
The renewed geopolitical optimism helped improve risk sentiment across financial markets, pushing Bitcoin back toward the $66,000...

XRP Price Analysis: Ripple Token Eyes 10% Gain with Flashing Bullish Pattern and ETF Inflows
XRP price posts 9% moves today from low $1.1 to $1.24, with a prediction that it could go even higher. Two independent tailwinds a...
XRP Price Prediction: Ripple Jumps 10% as Crypto Total Market Cap Closing $2.4T
XRP price is moving again, and this time, prediction and volume back it up. The token has run 10% in the past 24 hours, pushing th...

XRP Price Prediction: US-Iran Peace Deal Fuels 13% XRP Surge, Analysts Target $1.94 Retest
The latest move saw XRP price today reclaim the $1.28 level for the first time in nearly two weeks. Market participants pointed to...
Lummis Links Bitcoin to $39.2T US Debt Crisis as CLARITY Act Nears Senate Floor
Senator Cynthia Lummis publicly tied Bitcoin to America’s $39.2 trillion national debt crisis on June 15, positioning the asset as...